









.png?width=292&height=292&name=Copy%20Link%20(1).png)

 SIGN UP FOR FREE NEWSLETTER
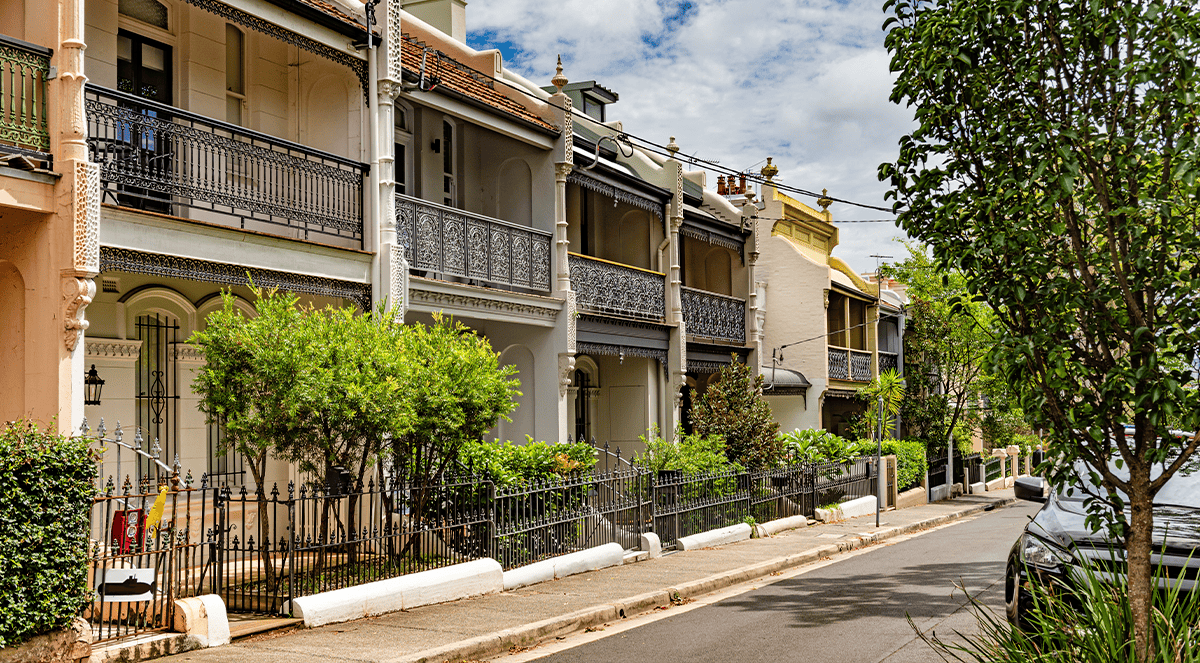
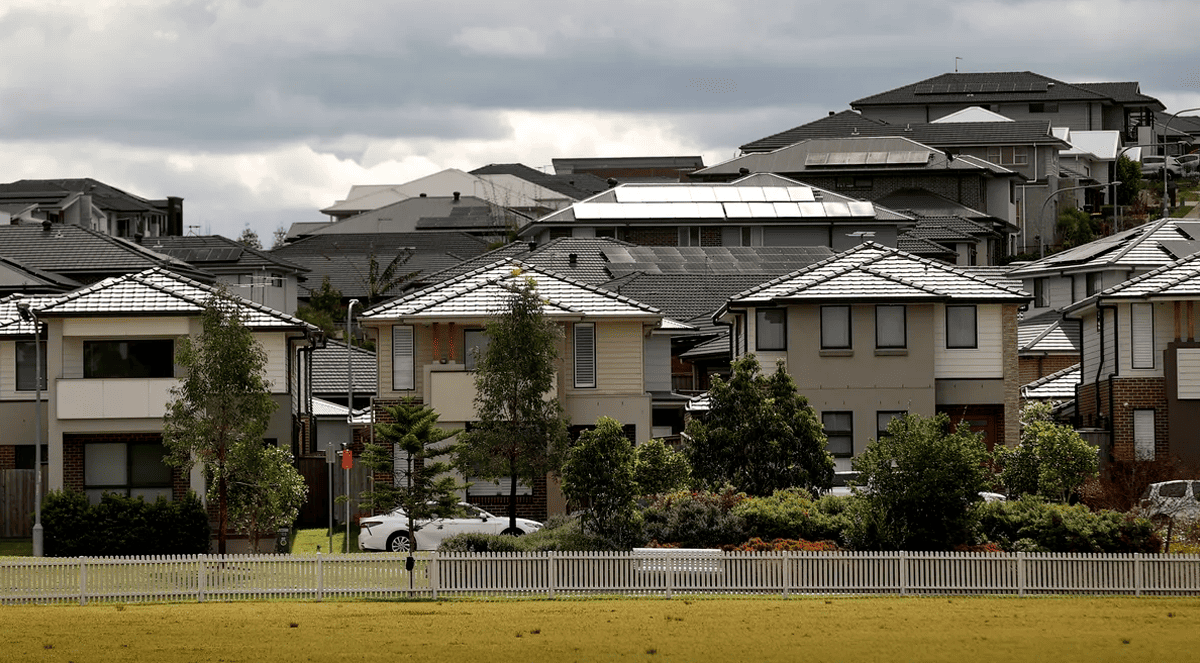
Australia’s property market has attracted plenty of dramatic descriptions lately.
Politicians have repeatedly described the housing system as “broken”, arguing home ownership has become increasingly difficult for younger Australians and that both the demand and supply sides of the market have failed.
Others have suggested the latest downturn is somehow different from previous property cycles, with falling prices spreading across the capitals and credit conditions tightening.
“This housing market downturn looks to be deeper and larger than any we've seen in many decades,” independent housing analyst Cameron Kusher commented recently, while Macrobusiness commentator Leith Van Onselen has described recent property price falls in Sydney as a “bloodbath”.
But new research from property consultancy Charter Keck Cramer argues the current divergence between Australia’s major housing markets is much less unusual than it looks.
After examining 40 years of house and unit values across Sydney, Melbourne, Brisbane, Perth and Adelaide, Charter Keck Cramer identified 46 periods when one market moved materially out of line with its peers.
Of those, 39 - or 85% - have already fully recalibrated.
Where those dislocations have completed their cycle, the median time required to return towards historical relative values was just 18 months.
For investors, the data highlights that several major housing markets are currently trading well below their historical relative-value position compared with the other capitals, and previous dislocations have overwhelmingly recalibrated over time.
The details
Charter Keck Cramer’s Richard Temlett and Andrew Fyfe examined how the values of houses and units in each of the five largest capitals compared with the other four cities over time.
A “dislocation” was defined as a city moving at least 10% above or below its historical relative-value norm for at least four consecutive months.
A market was considered to have recalibrated once that gap returned to within 2.5% of its long-run relationship with the other capitals.
The analysis spans everything from the financial deregulation and asset boom of the late 1980s, through the early-1990s recession, the Sydney Olympics, the mining boom, the Global Financial Crisis, pandemic stimulus and the recent interest-rate shock.
The researchers identified 11 distinct housing-market regimes over the period.
Their broader argument is that different cities repeatedly run ahead or fall behind one another because they are exposed to different economic forces.
Perth surged during the mining boom.
Sydney experienced major periods of relative overvaluation during the investor and foreign-capital boom.
Melbourne followed a different cycle again.
And the current period has been shaped by migration recovery, housing shortages and sharply divergent supply conditions.
“Every city has cycled through this more than once,” the report says.
“Dislocation and recalibration are the market’s normal mechanism for absorbing these shocks.
“The 40-year record is clear: every dislocation has recalibrated. This is a market behaving exactly as it always has — not one that is broken,” the authors say.
Melbourne and Sydney
Some of the current gaps are certainly substantial.
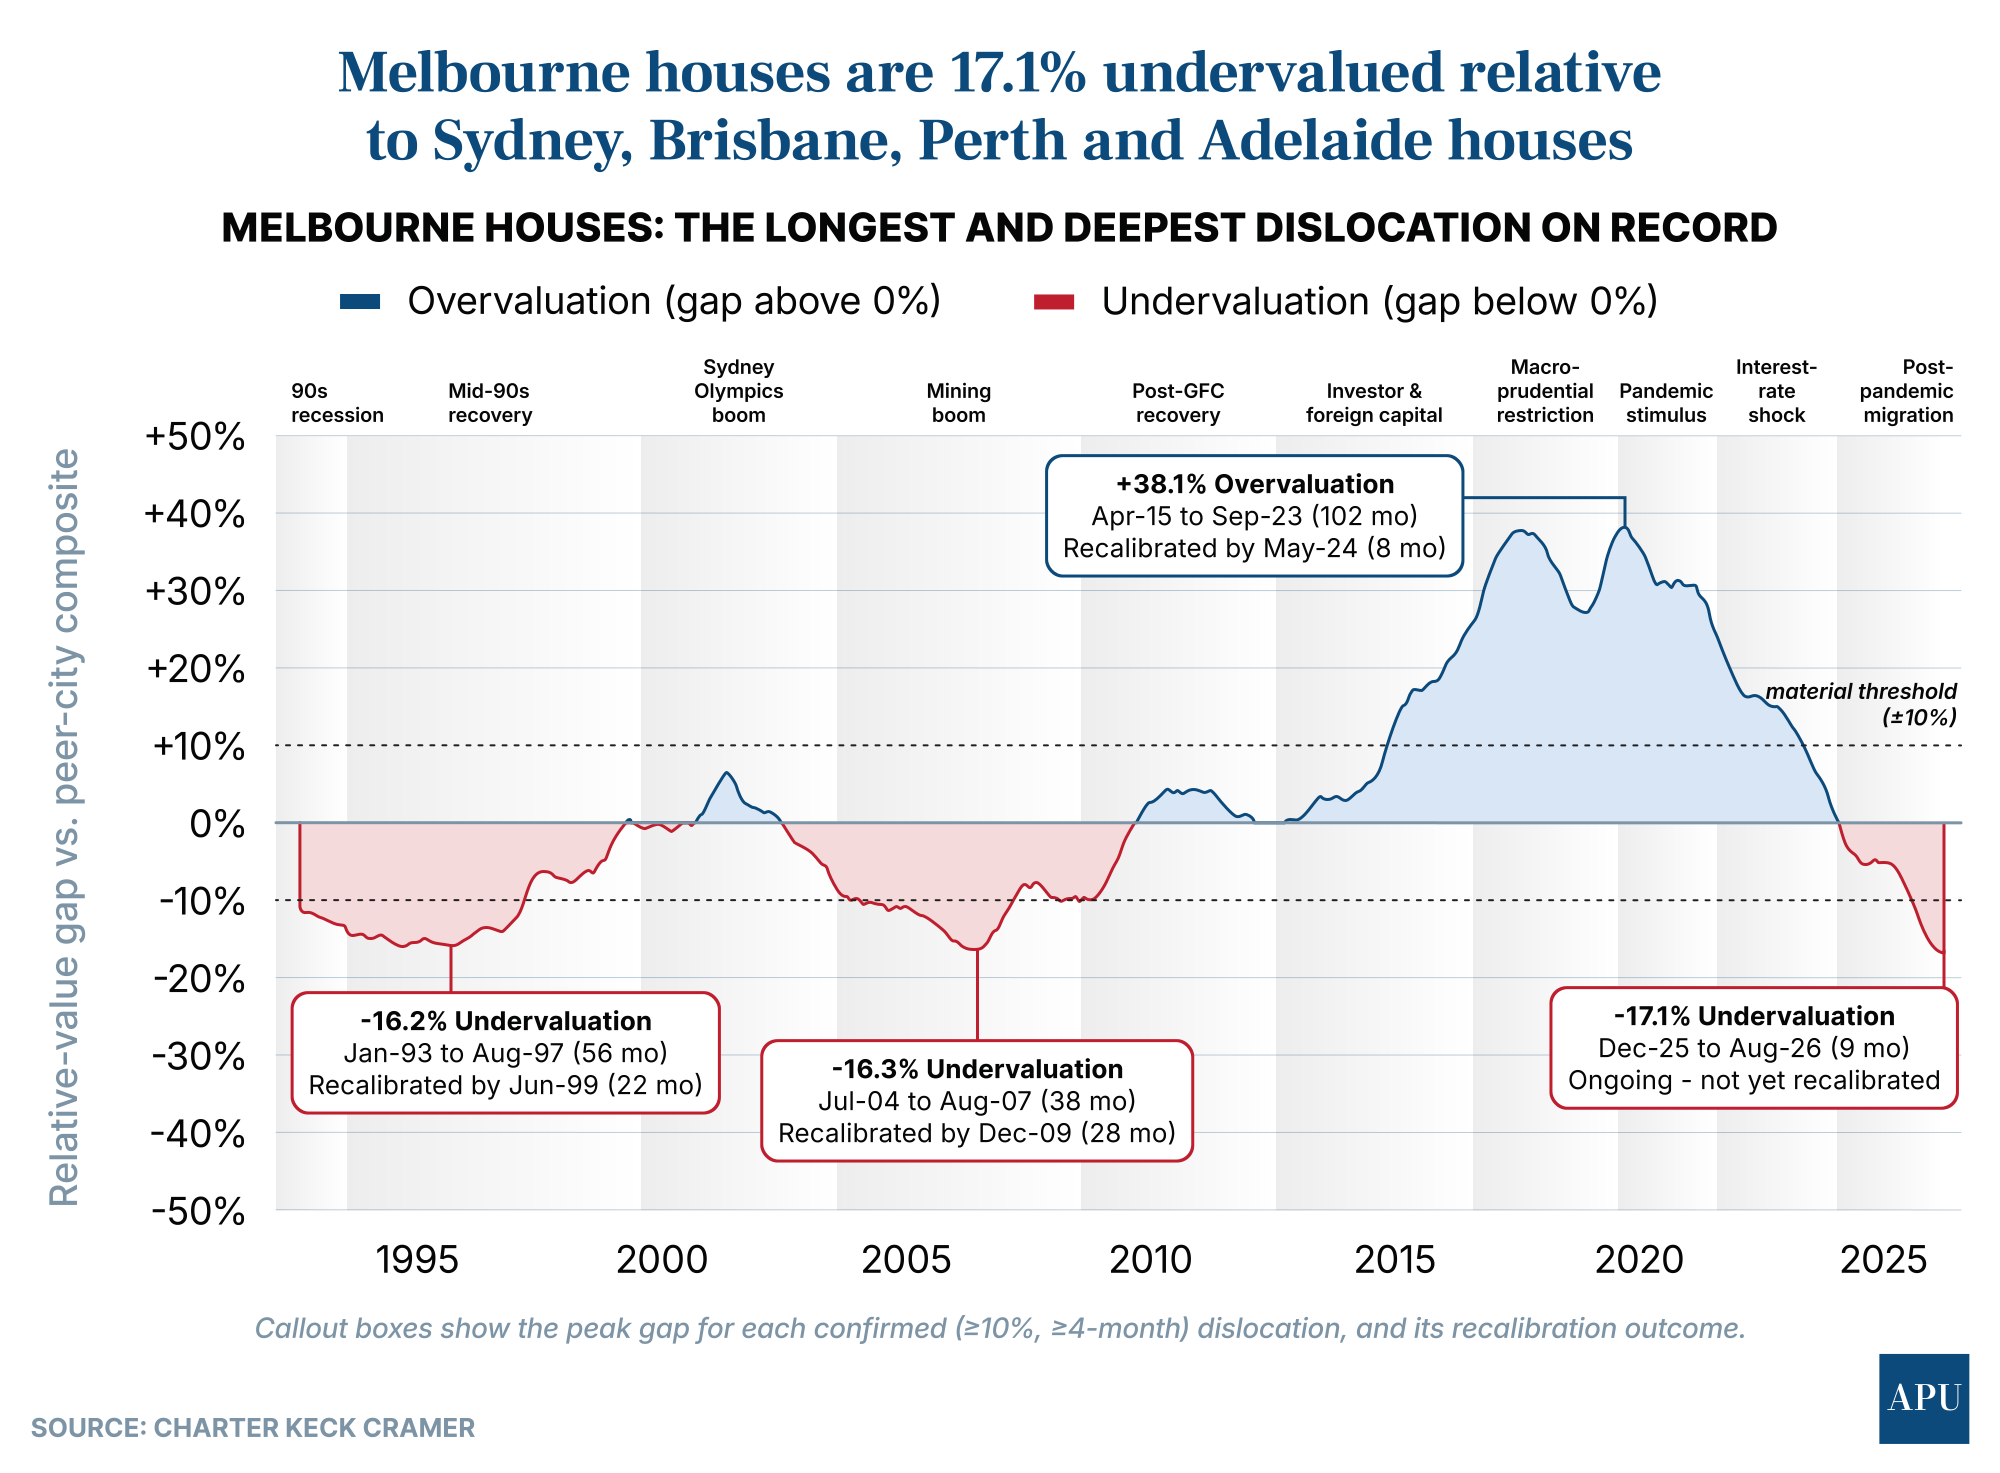
Melbourne houses are now around 17.1% undervalued relative to the other major capitals under Charter Keck Cramer’s methodology, after an extraordinary eight-and-a-half-year period of overvaluation that peaked at 38.1% above its long-run relative value.
That previous overvaluation has now completely unwound.
Melbourne units have moved even further, sitting around 26.5% below their historical relative-value position, the deepest unit-market dislocation recorded for the city.
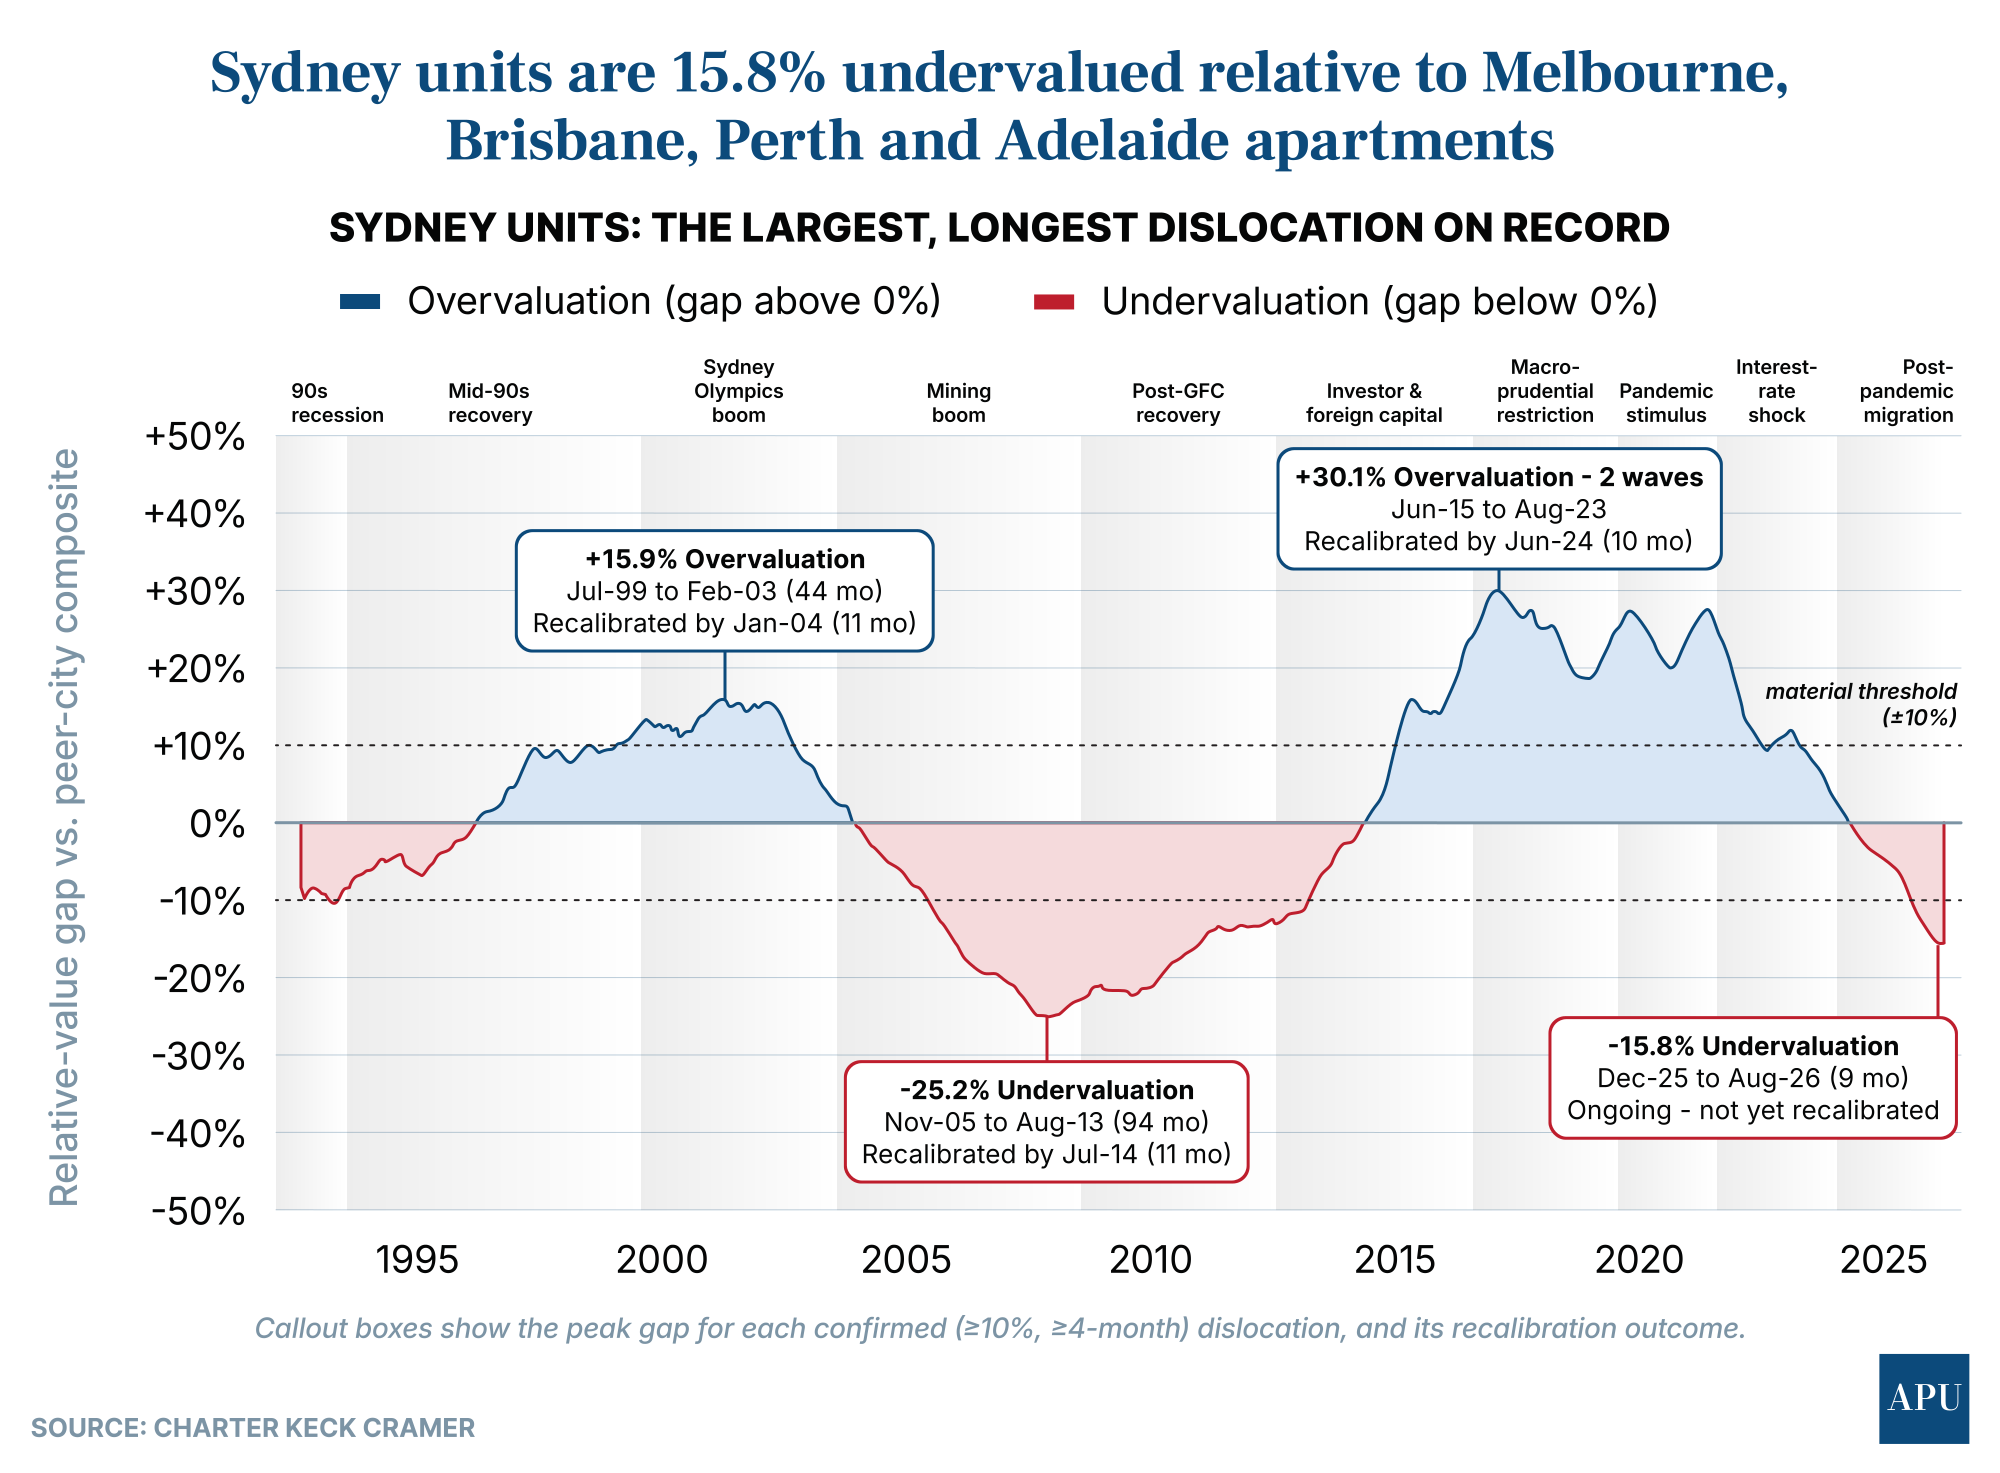
Sydney units are also around 15.8% undervalued, after an earlier seven-and-a-half-year overvaluation cycle that peaked at 30.1% and eventually recalibrated by mid-2024.
The important point is not that those markets must suddenly rebound.
Rather, Charter Keck Cramer says the scale of their current dislocation remains comfortably within the bounds of movements Australia has experienced before.
The current Melbourne, Sydney and Brisbane gaps are therefore “not outside the range the market has absorbed and recalibrated from before”.
Perth
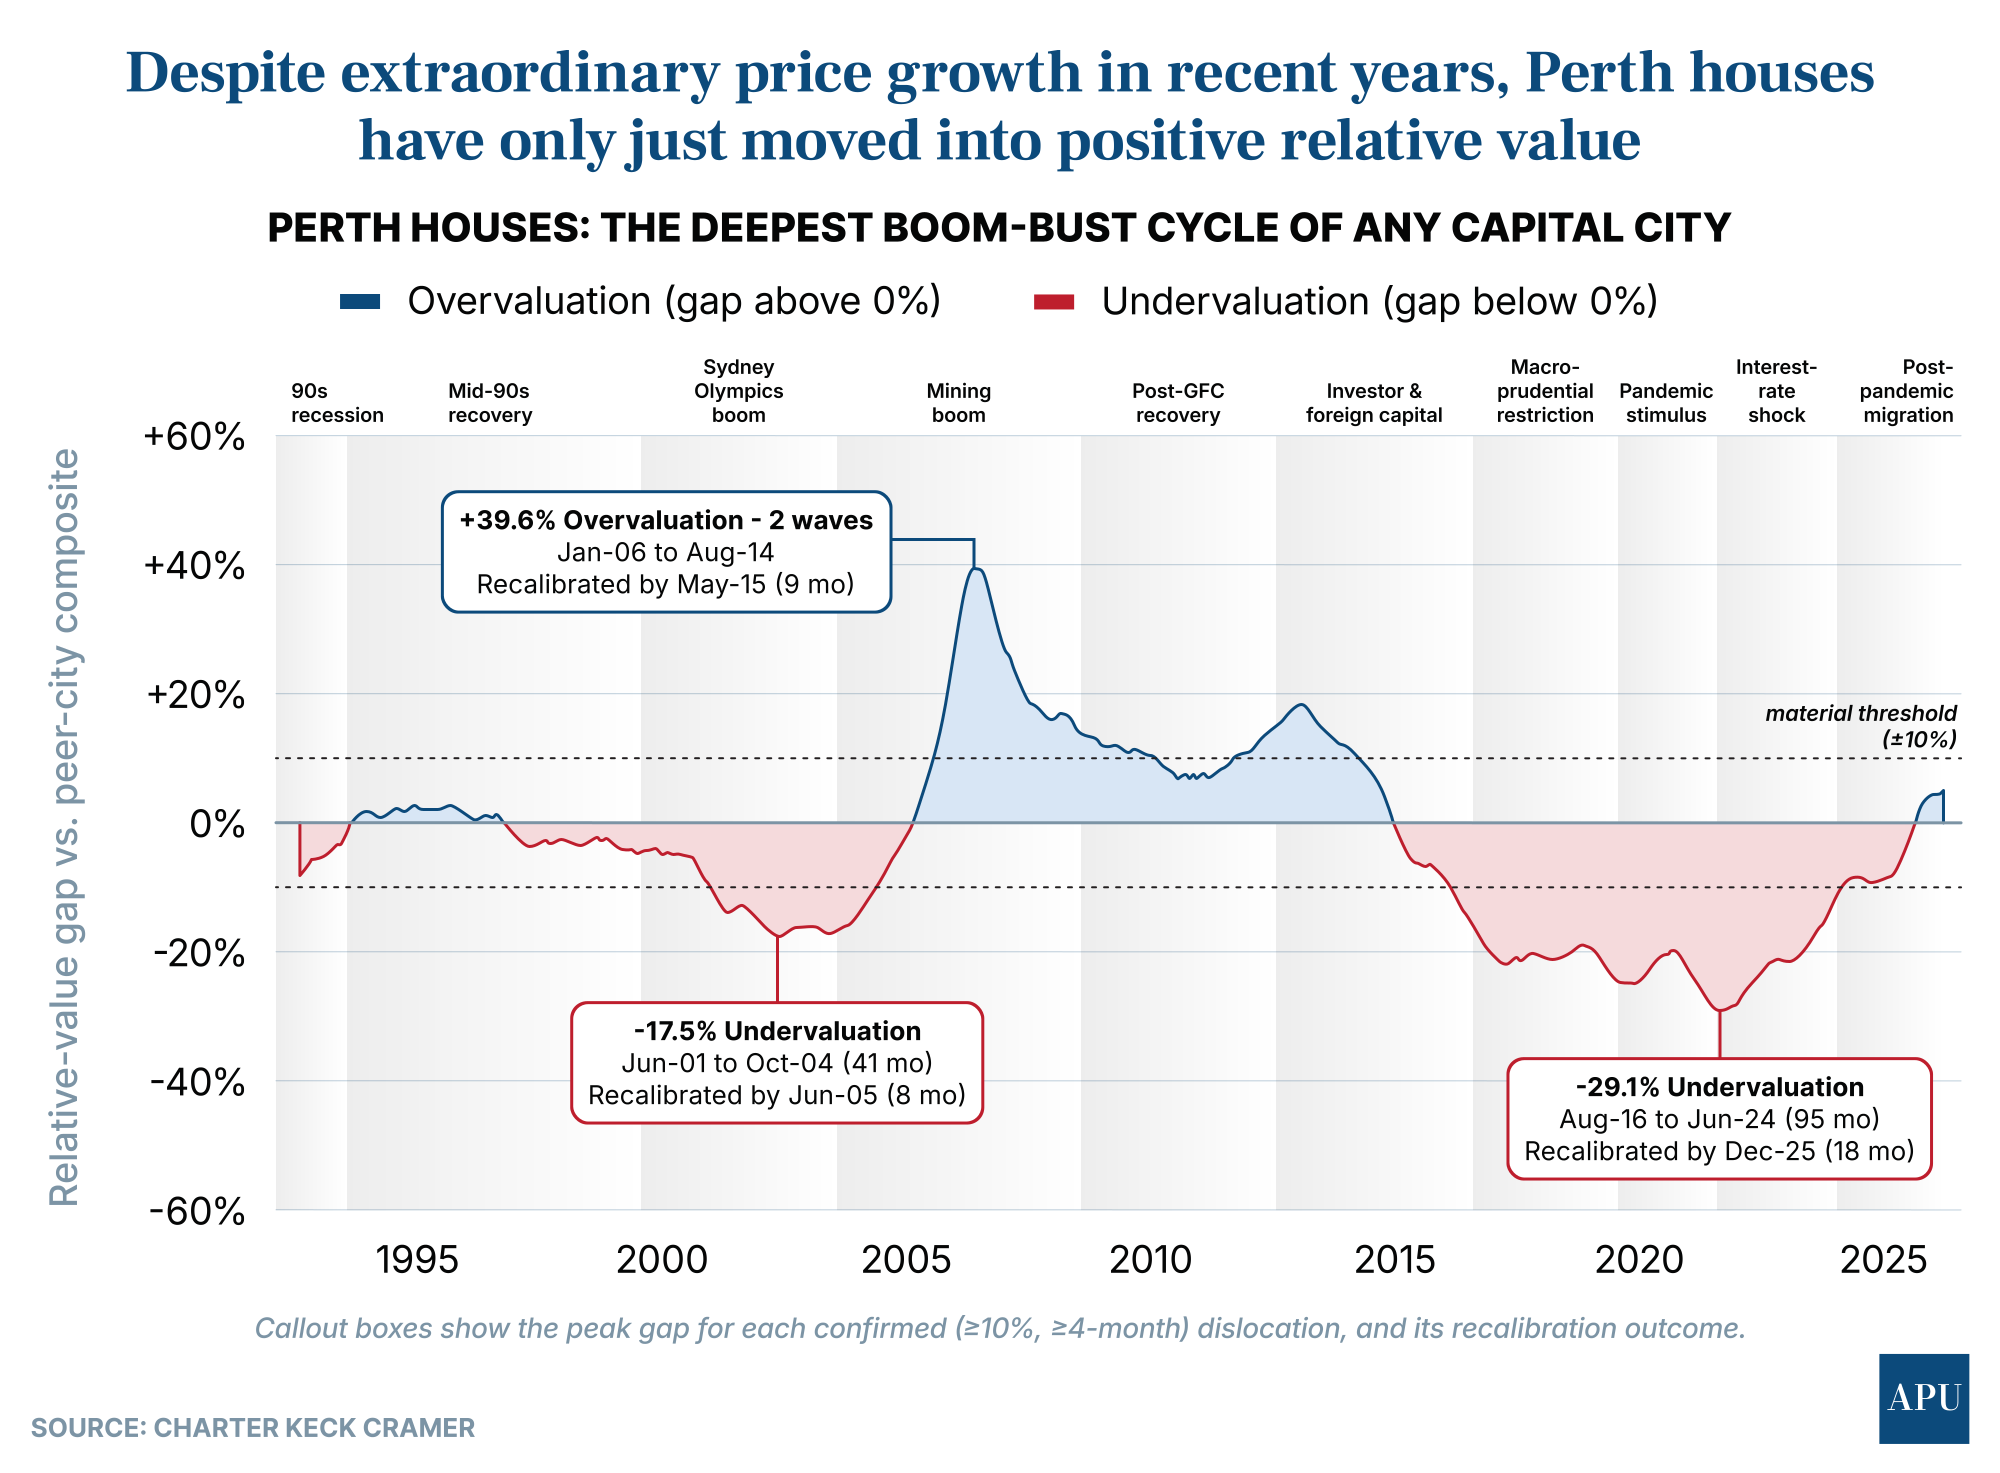
Perhaps the clearest example is Perth.
At the peak of the resources boom, Perth houses became 39.6% overvalued relative to the other capitals - the biggest positive gap in the entire dataset.
A decade later, the market had swung in the opposite direction, reaching a 29.1% undervaluation during an eight-year downturn.
That cycle finally recalibrated in December 2025.
Perth units followed almost exactly the same pattern, moving from a 39.2% overvaluation to a 26.7% undervaluation before returning to equilibrium late last year.
It’s a reminder that markets regarded as permanently expensive or permanently cheap can change dramatically as economic conditions, migration and investment flows shift.
Adelaide is a genuine outlier
There is, however, one market where Charter Keck Cramer says history is offering less reassurance.
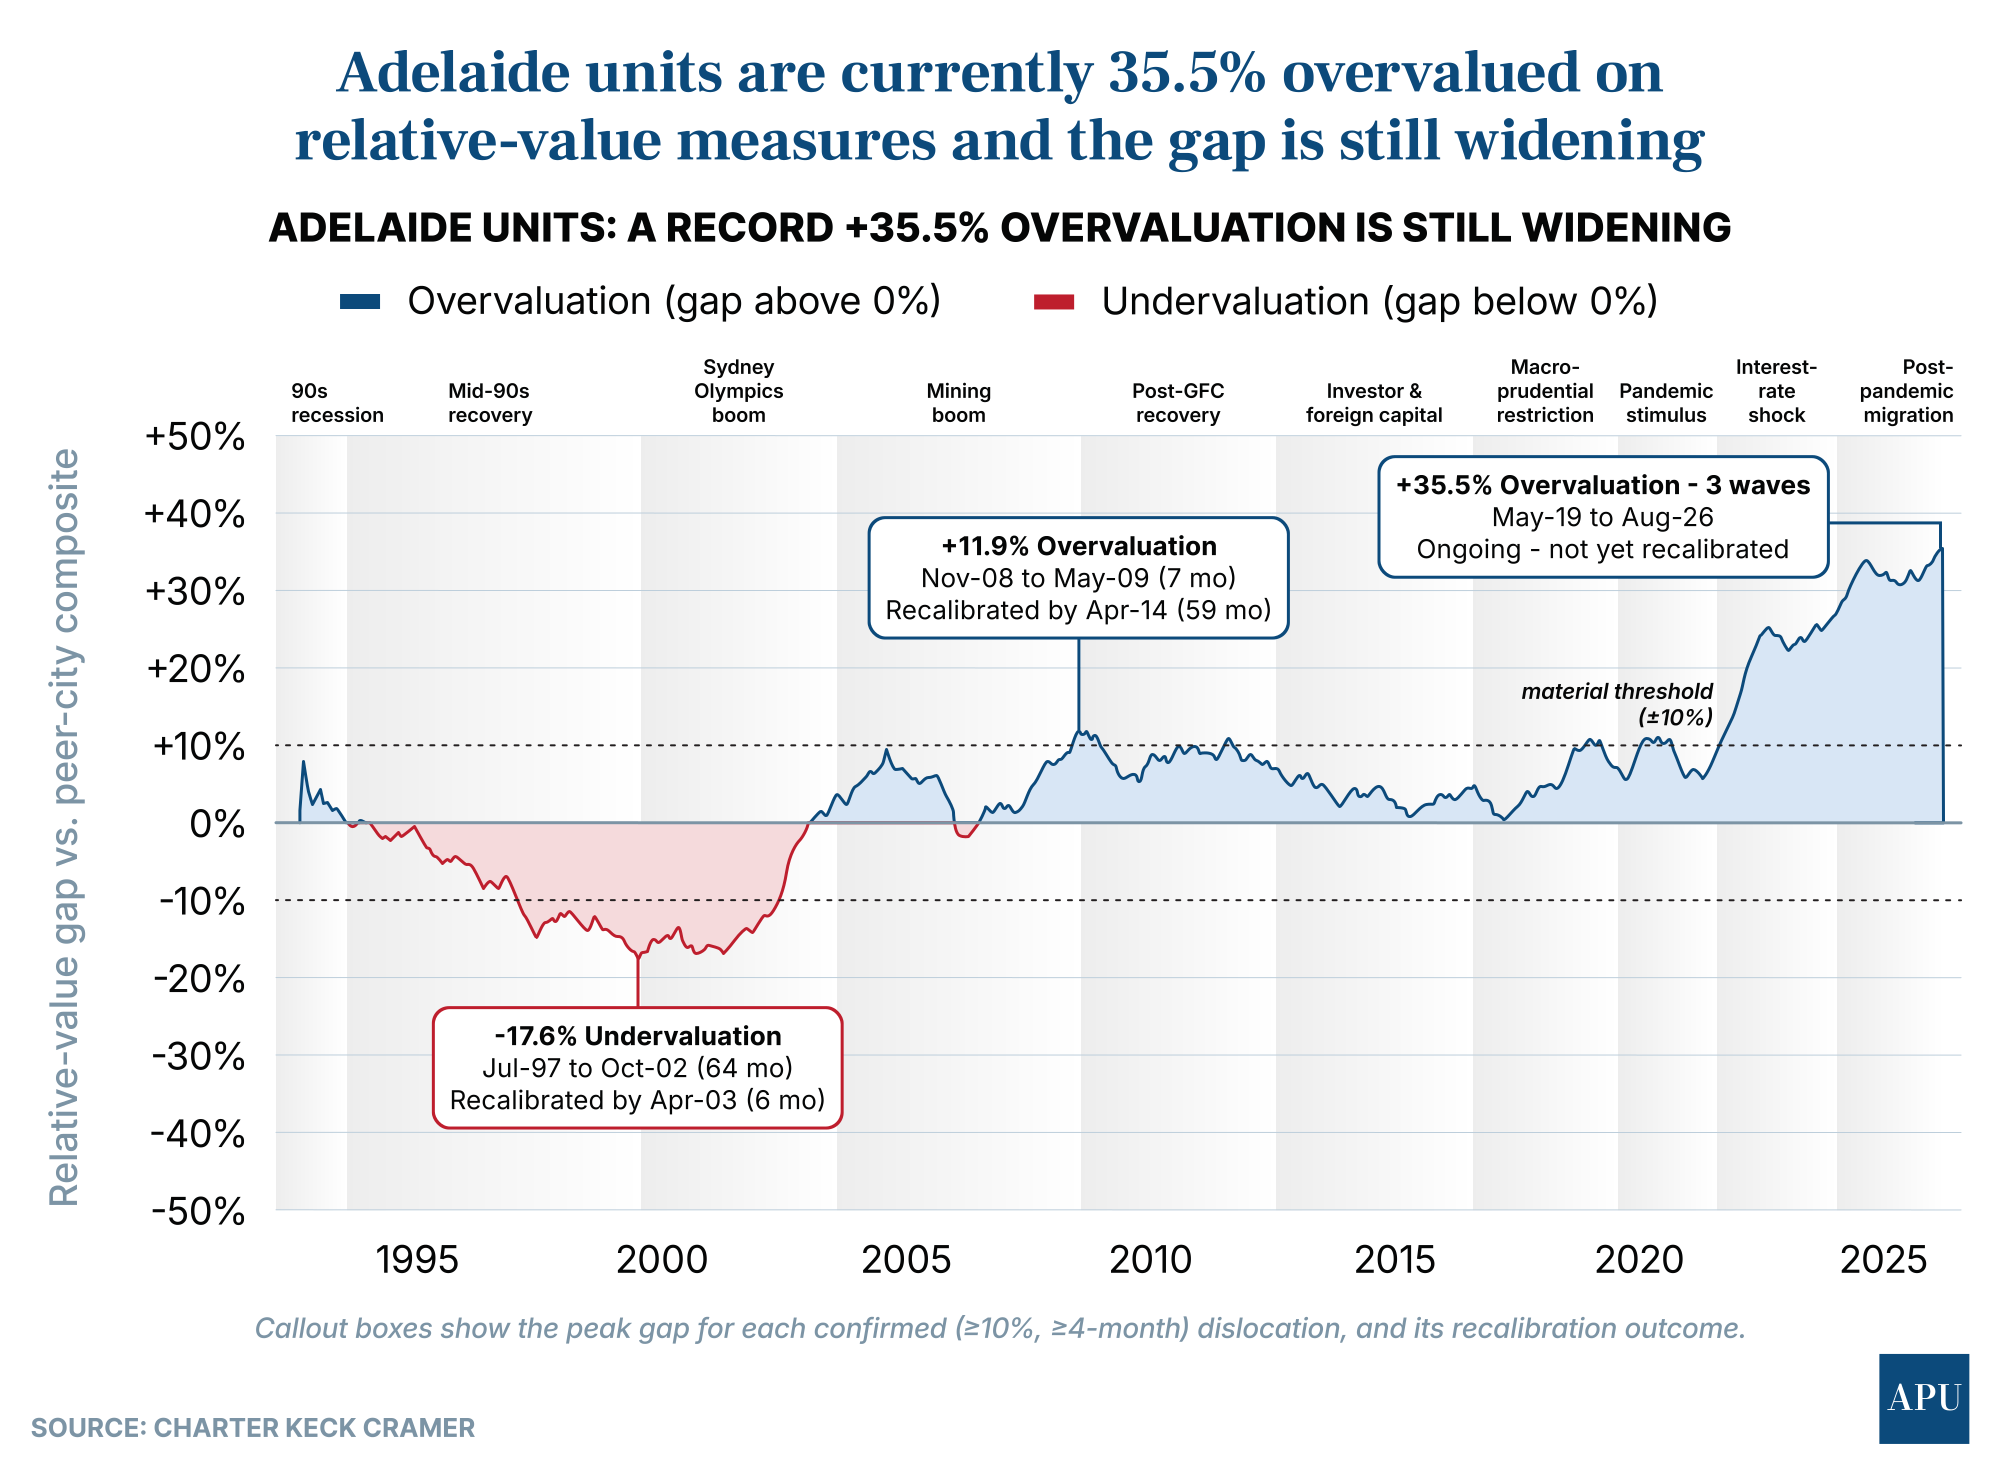
Adelaide units are currently 35.5% overvalued on Charter Keck Cramer’s relative-value measure.
They have remained above their historical norm continuously since 2022 and the gap was still widening in August 2026.
It is both the largest and longest-running overvaluation recorded for Adelaide units in the 40-year dataset, with “no recalibration yet in sight”.
That is particularly notable because Adelaide houses have never previously recorded a confirmed overvaluation under the researchers’ methodology.

The take-out
Charter Keck Cramer’s analysis does not say when Melbourne or Sydney prices will recover, nor does it suggest relative values must return to their historical norm through prices rising in the cheaper city.
Recalibration can occur through one market rising, another falling, or some combination of both.
Nor does it mean Australia has no serious housing affordability or supply problems.
But on the question of whether today’s differences between Melbourne, Sydney, Brisbane, Perth and Adelaide represent some unprecedented structural break, Charter Keck Cramer’s research provides a useful historical perspective.
Over four decades, Australian housing markets have repeatedly moved sharply out of line with one another.
And, so far, they have repeatedly moved back again.




.jpg?width=1920&height=1080&name=WTF%20Is%20Happening%20To%20The%20Housing%20Market!%20$500%20Billion%20Wiped%20Out%20As%20Prices%20Fall%20Faster%20Every%20Month%20Scott%20Kuru%20YPU%20027%20(1).jpg)
%20Scott%20Kuru%20YPU%20025.jpg?width=1920&height=1080&name=This%20Is%20Worse%20Than%20A%20Recession%20RBA%20Admits%20Australias%20Wage%20Collapse%20Cant%20Be%20Stopped%20(Prepare%20Now)%20Scott%20Kuru%20YPU%20025.jpg)



























.jpg?width=1920&height=1080&name=EXPOSED%20How%20The%20Govt%20Let%20These%20Oil%20Giants%20Get%20Away%20With%20Paying%20Zero%20Tax%20For%20Aussie%20Gas%20Scott%20Kuru%20DPU%20256%20(1).jpg)







%20Scott%20Kuru%20DPU%20248.jpg?width=1920&height=1080&name=Major%20Banks%20CAUGHT%20Preparing%20For%20Australia%E2%80%99s%20Biggest%20Housing%20Crash%20(Defaults%20%26%20Bankruptcies%20Coming)%20Scott%20Kuru%20DPU%20248.jpg)
%20Scott%20Kuru%20DPU%20247.jpg?width=1920&height=1080&name=This%20Is%20How%20Australia%20Gets%20Pushed%20Into%20the%20Next%20Big%20Reset%20(Trust%20Collapse%20Has%20Officially%20Begun)%20Scott%20Kuru%20DPU%20247.jpg)







%20Scott%20Kuru%20DPU%20239.jpg?width=1920&height=1080&name=URGENT%20Life%20In%20Australia%20Has%20Become%20Impossible%20For%20Millions%20Of%20Aussies%20(It%E2%80%99s%20About%20To%20Get%20Worse)%20Scott%20Kuru%20DPU%20239.jpg)











%20Scott%20Kuru%20DPU%20227.jpg?width=1920&height=1080&name=URGENT%20ALERT%20Australia%E2%80%99s%20Property%20Market%20Is%20Sliding%20Into%20Something%20Much%20Bigger%20(Prepare%20Now)%20Scott%20Kuru%20DPU%20227.jpg)





%20Scott%20Kuru%20DPU%20221.jpg?width=1920&height=1080&name=The%20AI%20Situation%20in%20Australia%20Just%20Hit%20a%20Point%20of%20No%20Return...%20(Major%20Bank%20Proves%20It)%20Scott%20Kuru%20DPU%20221.jpg)