









.png?width=292&height=292&name=Copy%20Link%20(1).png)

 SIGN UP FOR FREE NEWSLETTER

Image by Nicholas Eagar/NCA
Australia’s housing downturn may be less severe than some headline figures suggest, with new REA Group data showing national home prices are only 2.7% below their March 2026 peak and remain 1.8% higher than a year ago.
That’s a noticeably milder picture than the latest Cotality Home Value Index, which estimates national dwelling values are 3.6% below their March peak after falling 0.9% in August.
For investors, the more important takeaway may be that neither index points to anything resembling a national property collapse, while rent growth remains strong.
The details
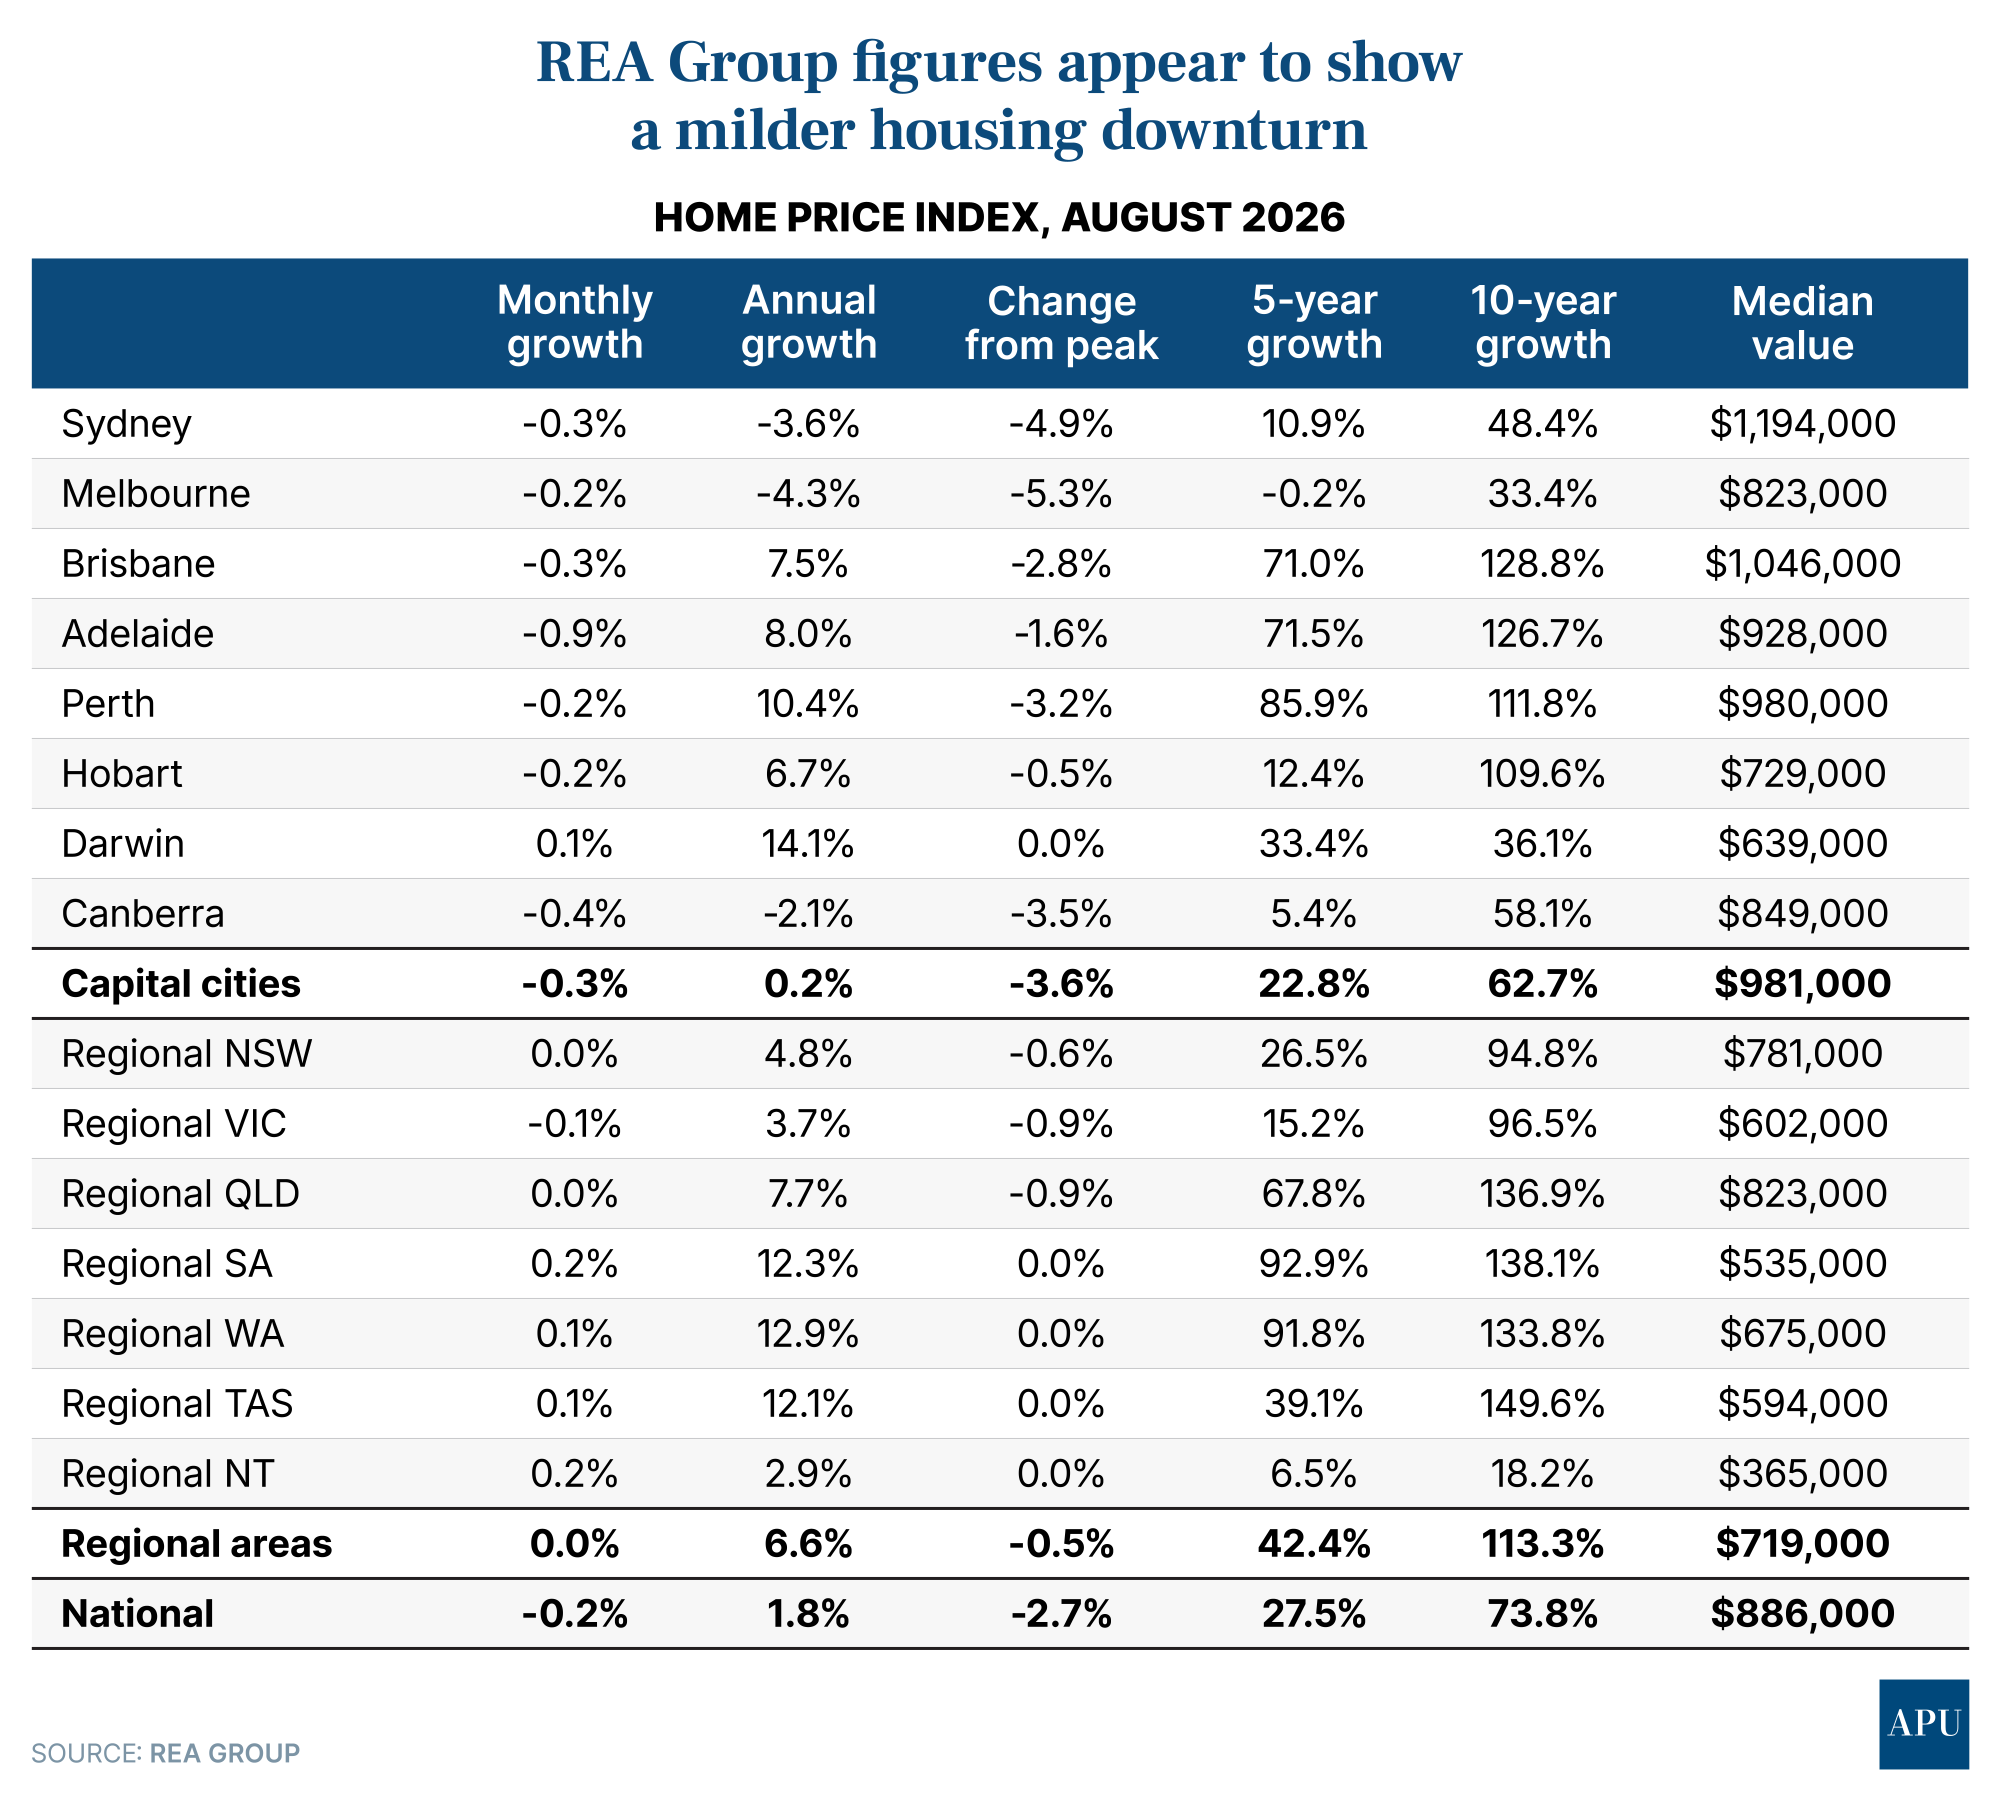
REA Group says national home prices fell 0.2% in August 2026, the fifth consecutive monthly decline.
Capital-city prices fell 0.3%, while regional prices were flat.
Sydney and Brisbane both slipped 0.3%, Melbourne fell 0.2%, Canberra fell 0.4% and Adelaide recorded the largest fall at 0.9%.
But the report also highlights how shallow the national correction remains.
At $886,000, the national median dwelling price is only 2.7% below its March peak and still 1.8% higher than in August last year.
“The housing downturn remains orderly, but increasingly uneven, with regional markets proving considerably more resilient than the capitals,” REA Group senior economist Eleanor Creagh says.
Regional prices are just 0.5% below their peak and have risen 6.6% over the past year, compared with annual growth of only 0.2% across the capitals.
Units are also holding up better than houses.
National unit prices slipped just 0.1% in August and remain 3% higher than a year ago, compared with annual growth of 1.5% for houses.
That suggests affordability continues to push buyers towards cheaper property types and regional markets.
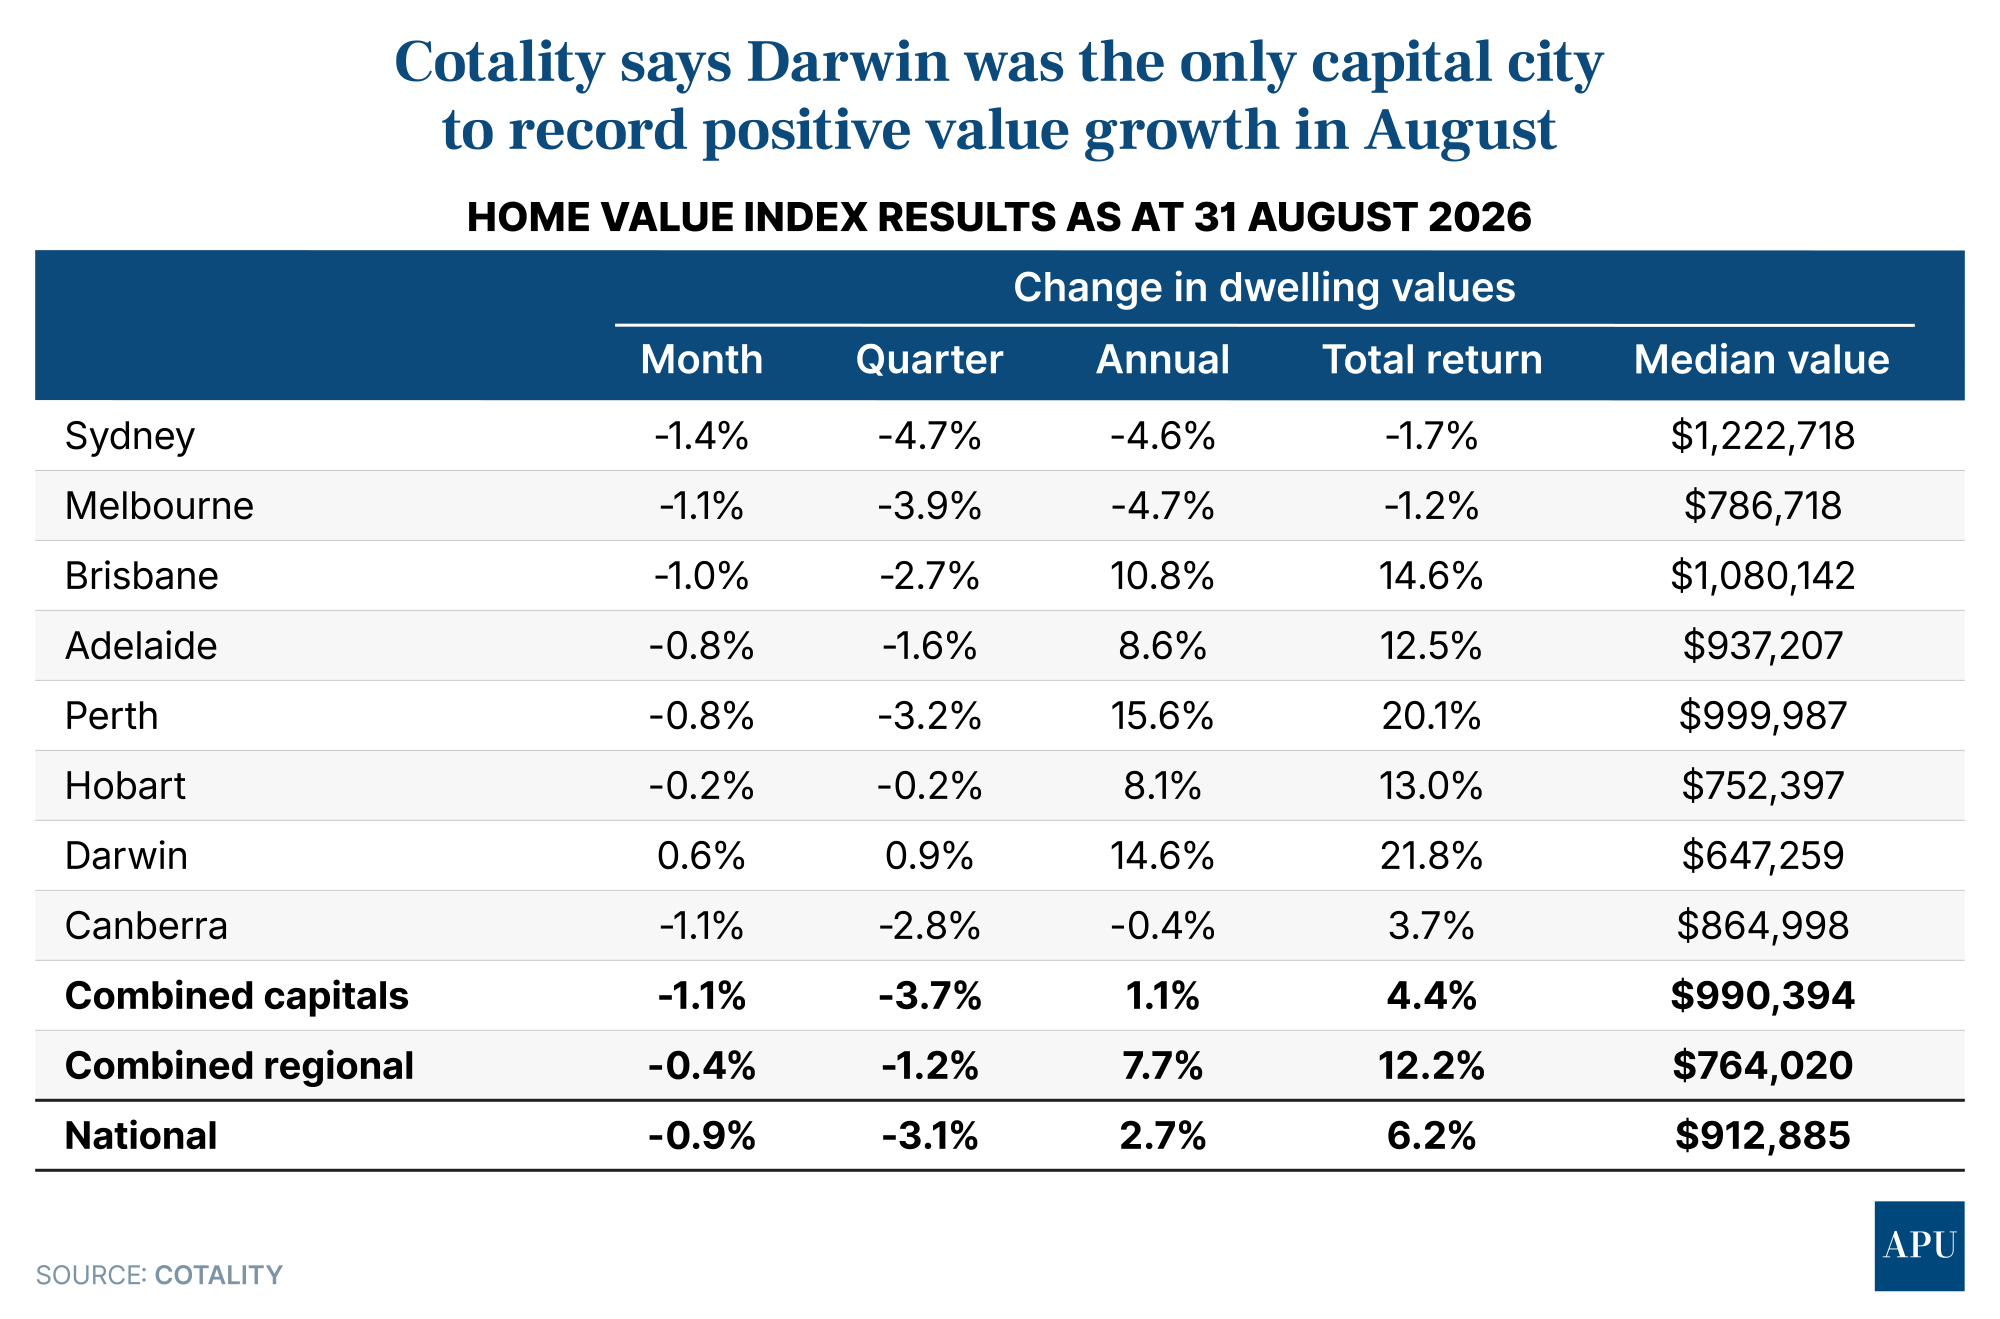
Cotality’s figures are more bearish.
Its national Home Value Index fell 0.9% in August, also marking a fifth consecutive monthly decline, and puts the national median dwelling value at $912,885, which is 3.6% below its March peak.
Sydney is down 7.1% from its February peak and Melbourne 6.8% below its high.
Brisbane is 2.7% below its peak, Adelaide 1.6% and Perth 3.2%.
Cotality Research Director Tim Lawless says the downturn has broadened well beyond prestige housing.
“What started as a more concentrated easing across higher-value segments has now become a much more generalised softening, with the vast majority of capital city suburbs recording some level of decline,” he says.
But Cotality’s own longer-term numbers also provide perspective.
Despite the recent decline, Brisbane values remain 64.1% higher than five years ago, Adelaide 64%, Perth 79.7% and national values 23.9% higher.
Even Sydney, despite its sharper correction, is still 5.6% above its level five years ago.
So while the monthly figures look weak, the downturn is occurring after several years of substantial capital growth.
The differences between the REA Group numbers and the Cotality data partly reflect differences in methodology.
REA Group’s realestate.com.au Home Price Report uses observed sales prices and a hedonic model to estimate changes in home values, adjusting for differences in the type, quality, location and timing of properties sold.
Cotality also uses sales data and hedonic modelling, but estimates a current value across the entire housing stock, including homes that have not recently changed hands.
For investors, REA Group’s figures provide some reason to question whether the national downturn is quite as deep as Cotality’s headline numbers imply.

Rental market
While capital growth may have weakened, the income side of the investment equation remains much stronger.
Cotality says national rents rose another 0.4% in August and are now 5.7% higher than a year ago.
That equates to an increase of roughly $38 a week in the national median rent over the past 12 months.
Over five years, rents have surged 39%, leaving tenants paying about $200 more per week than in 2021.
Vacancy rates remain tight at 1.9%, despite edging higher from the record low of 1.5% in February.
That’s still well below the pre-COVID decade average of 3.3%.
Perth has recorded the strongest five-year rental growth, with rents up 56%, equivalent to an increase of about $283 a week.
Falling home values and rising rents have also pushed national gross rental yields up to 3.79%, their highest level since September 2019.
“With changes to property taxation policies announced in the federal budget, investors are likely to place a greater emphasis on higher-yielding opportunities than they did before 12 May,” Mr Lawless says.
For investors, rapidly rising rents, tight vacancies and improving yields mean the property story is increasingly about total return rather than capital growth alone.




.jpg?width=1920&height=1080&name=WTF%20Is%20Happening%20To%20The%20Housing%20Market!%20$500%20Billion%20Wiped%20Out%20As%20Prices%20Fall%20Faster%20Every%20Month%20Scott%20Kuru%20YPU%20027%20(1).jpg)
%20Scott%20Kuru%20YPU%20025.jpg?width=1920&height=1080&name=This%20Is%20Worse%20Than%20A%20Recession%20RBA%20Admits%20Australias%20Wage%20Collapse%20Cant%20Be%20Stopped%20(Prepare%20Now)%20Scott%20Kuru%20YPU%20025.jpg)





























.jpg?width=1920&height=1080&name=EXPOSED%20How%20The%20Govt%20Let%20These%20Oil%20Giants%20Get%20Away%20With%20Paying%20Zero%20Tax%20For%20Aussie%20Gas%20Scott%20Kuru%20DPU%20256%20(1).jpg)







%20Scott%20Kuru%20DPU%20248.jpg?width=1920&height=1080&name=Major%20Banks%20CAUGHT%20Preparing%20For%20Australia%E2%80%99s%20Biggest%20Housing%20Crash%20(Defaults%20%26%20Bankruptcies%20Coming)%20Scott%20Kuru%20DPU%20248.jpg)
%20Scott%20Kuru%20DPU%20247.jpg?width=1920&height=1080&name=This%20Is%20How%20Australia%20Gets%20Pushed%20Into%20the%20Next%20Big%20Reset%20(Trust%20Collapse%20Has%20Officially%20Begun)%20Scott%20Kuru%20DPU%20247.jpg)







%20Scott%20Kuru%20DPU%20239.jpg?width=1920&height=1080&name=URGENT%20Life%20In%20Australia%20Has%20Become%20Impossible%20For%20Millions%20Of%20Aussies%20(It%E2%80%99s%20About%20To%20Get%20Worse)%20Scott%20Kuru%20DPU%20239.jpg)











%20Scott%20Kuru%20DPU%20227.jpg?width=1920&height=1080&name=URGENT%20ALERT%20Australia%E2%80%99s%20Property%20Market%20Is%20Sliding%20Into%20Something%20Much%20Bigger%20(Prepare%20Now)%20Scott%20Kuru%20DPU%20227.jpg)





%20Scott%20Kuru%20DPU%20221.jpg?width=1920&height=1080&name=The%20AI%20Situation%20in%20Australia%20Just%20Hit%20a%20Point%20of%20No%20Return...%20(Major%20Bank%20Proves%20It)%20Scott%20Kuru%20DPU%20221.jpg)