


.png?width=292&height=292&name=Copy%20Link%20(1).png)

 SIGN UP FOR FREE NEWSLETTER

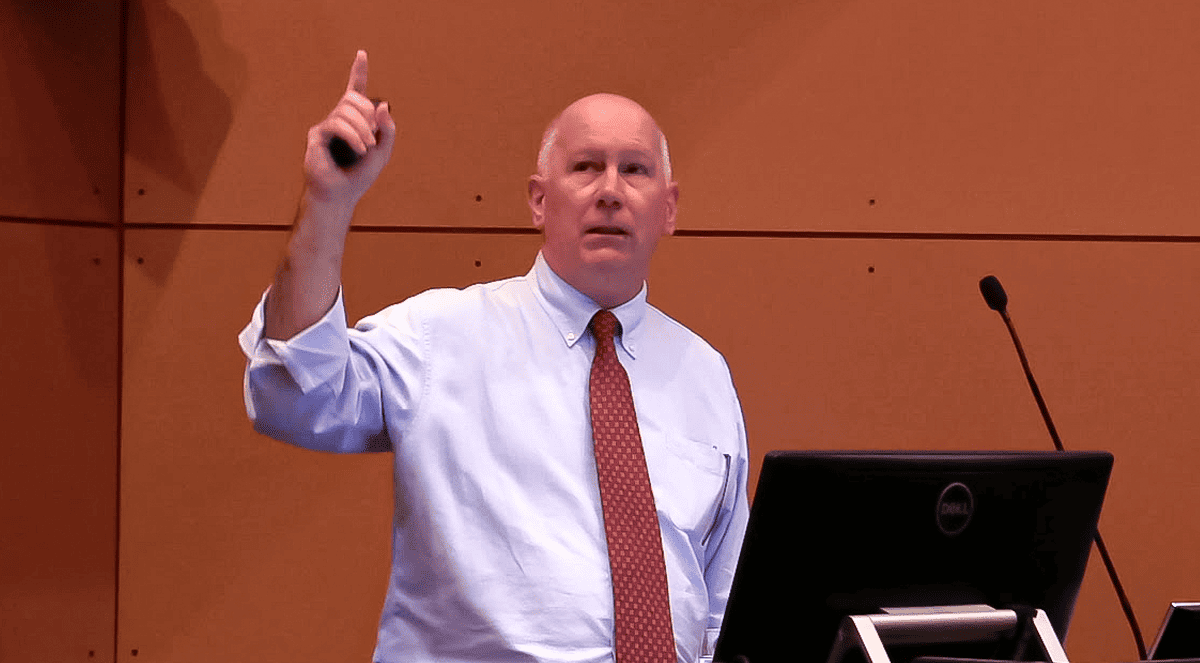
One of Australia’s leading economists and housing market watchers has penned a brilliant and easy-to-understand summary of the current state of residential property in this country.
AMP’s Chief Economist, Dr Shane Oliver, says housing in Australia - which, as we all know, is in crisis - can best be summed up in just 7 charts.
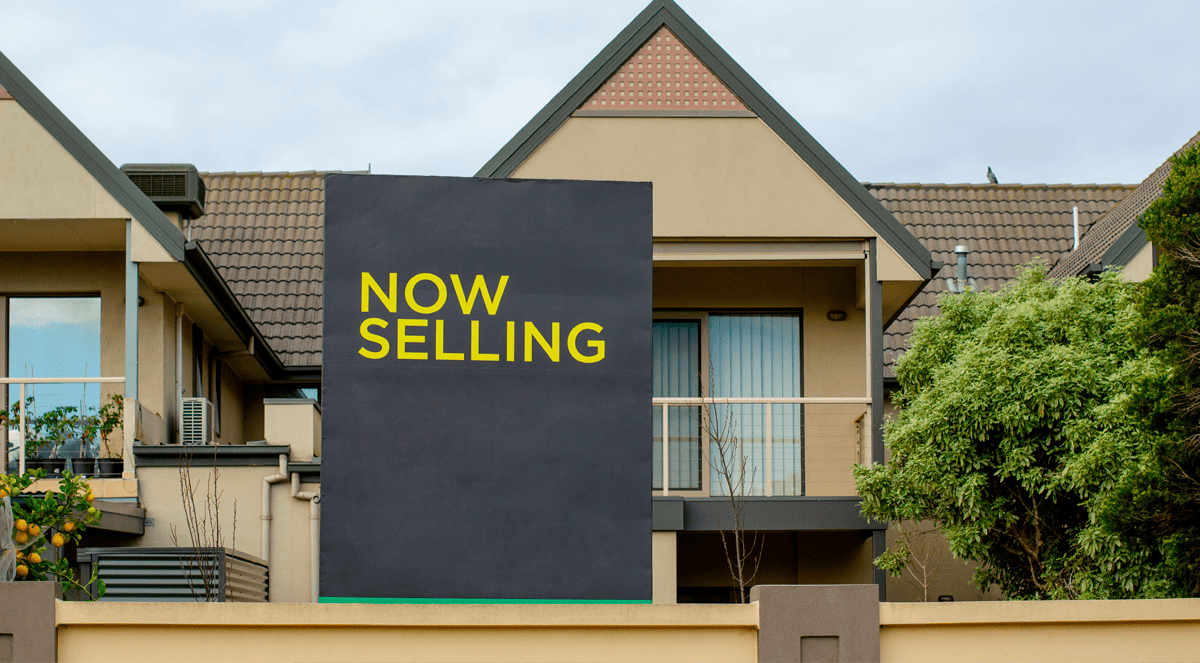
Home prices
Shane Oliver says if you really want to understand the Australian property market, you need to start with dwelling prices.

After a slowdown late last year, growth has picked up again.
Data analytics firm Cotality says dwelling prices in Australia’s capital cities gained 0.6% during July and 1.8% during the last quarter.
Why are they picking up?
“It's pretty obvious,” says Shane Oliver, “interest rates are coming back down again.”
“When rates go down, people can borrow more and property looks more attractive in a relative sense as an investment,” he says.
Interest rates

Dr Oliver has compiled the table above which shows what’s happened since 1982 when the Reserve Bank of Australia began a rate-cutting cycle.
It shows there’s been a clear link with higher home prices over the next 12 and 18 months in five of the last seven rate-cutting cycles…providing there is no recession.
He says the average gain over the subsequent 12 and 18 months is 3.9% and 8%.
Given the RBA began cutting rates from a 12-year high in February, Shane Oliver says that for this cycle, “our base case is for 0.25% RBA rate cuts in August, November (2025), February and May (2026).”
“With increasing signs of labour market weakness, this may occur faster with back-to-back cuts in August and September.”
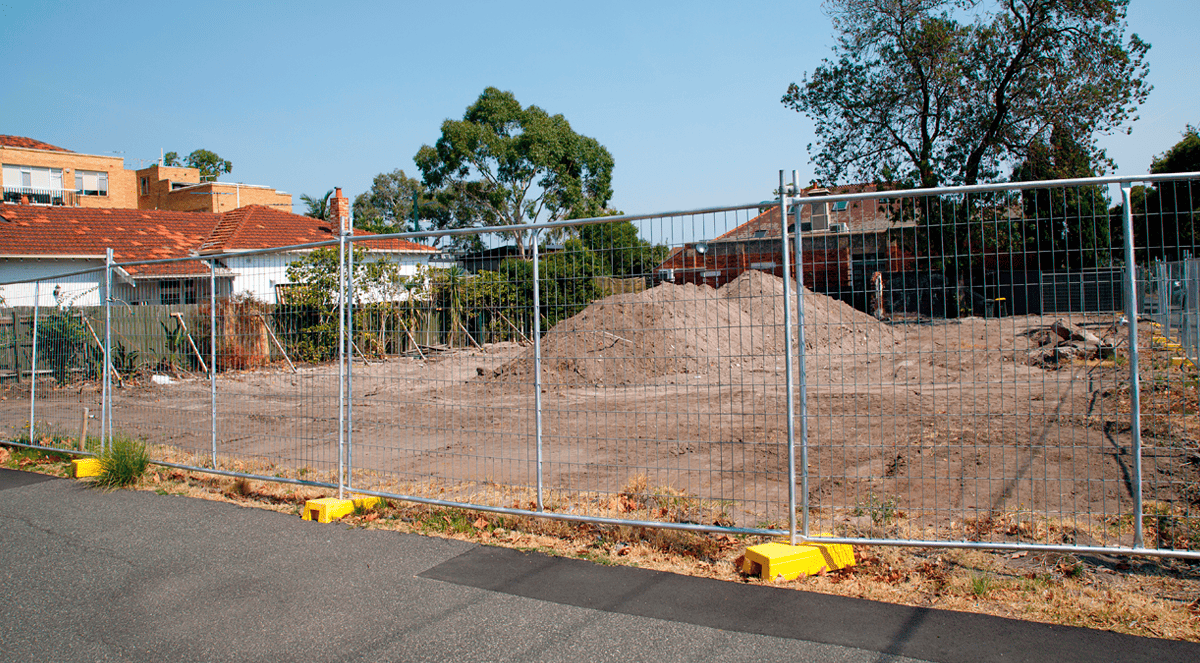
Supply
Home prices and interest rates are not the only things driving the Australian property market.
“The other big factor is lack of supply,” AMP’s Shane Oliver says.
“We've got a massive shortfall of housing in Australia relative to the number of people.”

AMP estimates there’s a shortfall of between 200,000 and 300,000 homes in Australia for our existing population.
“The economic reality is that when underlying population-driven demand for housing exceeds its supply, prices rise and that is what we have been seeing for the last twenty years.”
Time to build
“Obviously, we know the story about high immigration levels,” Dr Oliver says, “but the other side of the story is that it's taking longer and longer to build a home in Australia.

In the last 10 years, he says there’s been more than a 50% increase in the time taken to complete a property - from approval to completion stage - whether it's a unit or a free-standing house.
AMP’s Shane Oliver says this reflects increasing regulations, rising costs and labour shortages.
To meet the government’s National Housing Accord target of building 1.2 million new homes by mid-2029, Dr Oliver says “we need deregulation, measures to boost the number homebuilders, a greater focus on units and finding more ways to lower costs - like pattern plans in New South Wales, smaller houses and greater reliance on wood than bricks and concrete.”
Affordability
While lower interest rates and a housing shortfall are pushing property prices up, AMP’s Shane Oliver says there is “one big constraint, and that is poor affordability, which makes it harder for people to get into the property market.”

Dr Oliver says “chronically deteriorating housing affordability” has been evident since the 1990s.
His chart compares the ratio of average annual wages and median household disposable income (usually made up of two incomes) to home prices.
“In other words, if you could put all of your household income towards buying a property, it would have taken you four years to do that 20 years ago,” he says.
“Now it's taking you around eight years.
“So, affordability is acting as a bit of a constraint on the property market.
“Of course, affordability varies dramatically from city to city,” Dr Oliver says.
“Sydney is one of the worst, particularly when it comes to houses.
“At the other extreme, you've got Melbourne and Perth,” he says, which in a relative sense, are “still somewhat cheap compared to other cities.”
Which leads us to the next chart…
Value
If housing affordability in Sydney is bad, while Perth and Melbourne are relatively affordable, where can value be found?
Using the kind of metrics market analysts use to value stocks, Shane Oliver and the team at AMP have produced the following chart.

It shows the percentage difference between price to annual rent ratios, adjusted for inflation, relative to their average since 1983.
“On this basis, while houses are 30% overvalued, units are only 1% overvalued,” Shane Oliver says.
“Perth, and interestingly Melbourne, stand out as the least overvalued markets in terms of houses and both are actually undervalued in terms of units.”
Mortgage stress

Shane Oliver says the final point to consider when assessing the current state of the Australian housing market is the ability of homebuyers to actually service the loans on their expensive homes.
“We hear a lot about mortgage stress, but when we look at actual delinquency numbers…it's historically low.”
Shane Oliver says that at 1% of total housing loans, this is also low by international standards.
“So, that's why we're not seeing this avalanche of listings out there with people struggling on their loans and having to sell.”
Dr Oliver says the low level of arrears partly reflects strong lending standards in Australia, combined with a strong jobs market and a high level of savings buffers coming out of the pandemic.

The outlook
So, given all this - an affordability and supply crisis - where to from here?
“Our base case is for property prices to rise 5-6% this year, driven by rate cuts and the chronic housing shortage but with poor affordability constraining the upswing,” Shane Oliver says.
“The main downside risk is that rising unemployment and a delay in rate cuts depresses buyer demand, but the main upside risk is that another bout of FOMO takes hold as rates fall.
“The key for savvy investors is to look for properties offering decent rental yields,” he says.


%20Scott%20Kuru%20DPU%20248.jpg?width=1920&height=1080&name=Major%20Banks%20CAUGHT%20Preparing%20For%20Australia%E2%80%99s%20Biggest%20Housing%20Crash%20(Defaults%20%26%20Bankruptcies%20Coming)%20Scott%20Kuru%20DPU%20248.jpg)
%20Scott%20Kuru%20DPU%20247.jpg?width=1920&height=1080&name=This%20Is%20How%20Australia%20Gets%20Pushed%20Into%20the%20Next%20Big%20Reset%20(Trust%20Collapse%20Has%20Officially%20Begun)%20Scott%20Kuru%20DPU%20247.jpg)


%20Scott%20Kuru%20DPU%20239.jpg?width=1920&height=1080&name=URGENT%20Life%20In%20Australia%20Has%20Become%20Impossible%20For%20Millions%20Of%20Aussies%20(It%E2%80%99s%20About%20To%20Get%20Worse)%20Scott%20Kuru%20DPU%20239.jpg)


%20Scott%20Kuru%20DPU%20227.jpg?width=1920&height=1080&name=URGENT%20ALERT%20Australia%E2%80%99s%20Property%20Market%20Is%20Sliding%20Into%20Something%20Much%20Bigger%20(Prepare%20Now)%20Scott%20Kuru%20DPU%20227.jpg)


%20Scott%20Kuru%20DPU%20221.jpg?width=1920&height=1080&name=The%20AI%20Situation%20in%20Australia%20Just%20Hit%20a%20Point%20of%20No%20Return...%20(Major%20Bank%20Proves%20It)%20Scott%20Kuru%20DPU%20221.jpg)


%20Scott%20Kuru%20DPU%20218.jpg?width=1920&height=1080&name=URGENT%20Australia%E2%80%99s%20Diesel%20Supply%20Is%20Far%20Worse%20Than%20People%20Realise%20(Major%20Bank%20Warns)%20Scott%20Kuru%20DPU%20218.jpg)

%20Scott%20Kuru%20DPU%20216.jpg?width=1920&height=1080&name=This%20Is%20How%20Recessions%20Start%20Aussies%20Are%20Shutting%20Their%20Wallets%20(Prepare%20Now)%20Scott%20Kuru%20DPU%20216.jpg)


%20Scott%20Kuru%20DPU%20213.jpg?width=1920&height=1080&name=BREAKING%20Australia%E2%80%99s%20Govt%20Just%20Got%20Caught%20(The%2047%25%20%E2%80%9CPartner%E2%80%9D%20Tax%20Grab)%20Scott%20Kuru%20DPU%20213.jpg)


%20Scott%20Kuru%20DPU%20203.jpg.jpg?width=1920&height=1080&name=Australia%E2%80%99s%20Housing%20Crisis%20Just%20Flipped%20Again%20(BIGGEST%20MARKET%20CRASH%20COMING)%20Scott%20Kuru%20DPU%20203.jpg.jpg)


%20Scott%20Kuru%20DPU%20200.jpg?width=1920&height=1080&name=The%20Govt%E2%80%99s%20Biggest%20Money%20Grab%20The%20Average%20Aussie%20Is%20Getting%20Crushed%20(And%20It%E2%80%99s%20Getting%20Worse)%20Scott%20Kuru%20DPU%20200.jpg)

%20Scott%20Kuru%20DPU%20198.jpg?width=1920&height=1080&name=Farmers%20Panic%20as%20Fuel%20Crisis%20Takes%20Over%20Australia%E2%80%99s%20Fertiliser%20Supply%20(Food%20Shock%20Has%20Begun)%20Scott%20Kuru%20DPU%20198.jpg)
%20Scott%20Kuru%20DPU%20197.jpg?width=1920&height=1080&name=URGENT%20Australia%E2%80%99s%20Property%20Market%20Is%20One%20Rate%20Hike%20Away%20From%20Snapping%20(This%20Is%20How%20It%20Starts)%20Scott%20Kuru%20DPU%20197.jpg)

%20Scott%20Kuru%20DPU%20195.jpg?width=1920&height=1080&name=The%20Biggest%20$83Bn%20Housing%20Scam%20Just%20Got%20Exposed%20(They%E2%80%99re%20Addicted%20to%20Taxing%20the%20Everyday%20Aussie)%20Scott%20Kuru%20DPU%20195.jpg)


%20Scott%20Kuru%20DPU%20192.jpg?width=1920&height=1080&name=The%20Middle%20Class%20Is%20Getting%20Wiped%20Out%20of%20Housing%20(Even%20When%20They%20Do%20Everything%20Right)%20Scott%20Kuru%20DPU%20192.jpg)


%20Scott%20Kuru%20DPU%20184.jpg?width=1920&height=1080&name=The%20Biggest%20Construction%20Collapse%20In%20Australian%20History%20Just%20Got%20Worse%20(300%2c000%20Homes%20Scrapped)%20Scott%20Kuru%20DPU%20184.jpg)
%20Scott%20Kuru%20DPU%20183.jpg?width=1920&height=1080&name=Australia%20To%20Declare%20Oil%20Emergency%20As%20US%20Cuts%20Off%20Oil%20Supply%20To%20Singapore%20(Oil%20Deal%20Under%20Threat)%20Scott%20Kuru%20DPU%20183.jpg)


.jpg?width=1920&height=1080&name=BREAKING%20The%20Govt%20Just%20Got%20Caught%20Red-Handed%20Manipulating%20Inflation%20-%20%20What%20They%E2%80%99re%20Not%20Telling%20You%20Scott%20Kuru%20DPU%20174%20(1).jpg)


%20Scott%20Kuru%20DPU%20%20171.jpg?width=1920&height=1080&name=BREAKING%20Something%20Big%20Just%20Flipped%20Australia%E2%80%99s%20Housing%20Market%20Outlook%20(No%20One%20Saw%20It%20Coming)%20Scott%20Kuru%20DPU%20%20171.jpg)
%20Scott%20Kuru%20DPU%20170.jpg?width=1920&height=1080&name=BREAKING%20Did%20Australia%20Just%20Sign%20the%20Worst%20Trade%20Deal%20with%20Europe%20(Ripped%20Off%20by%20$10B)%20Scott%20Kuru%20DPU%20170.jpg)