House prices have always been a hot topic of conversation, occupying many weekend barbecue banters, and dinner table debates.
They tend to go through cycles of strong growth and then a decline, but the bottom line is that the trajectory of house prices has been undeniably upwards since the late 1940’s.
Over the past 60 years, house prices have doubled seven times, according to a whitepaper by Pexa and Longview.
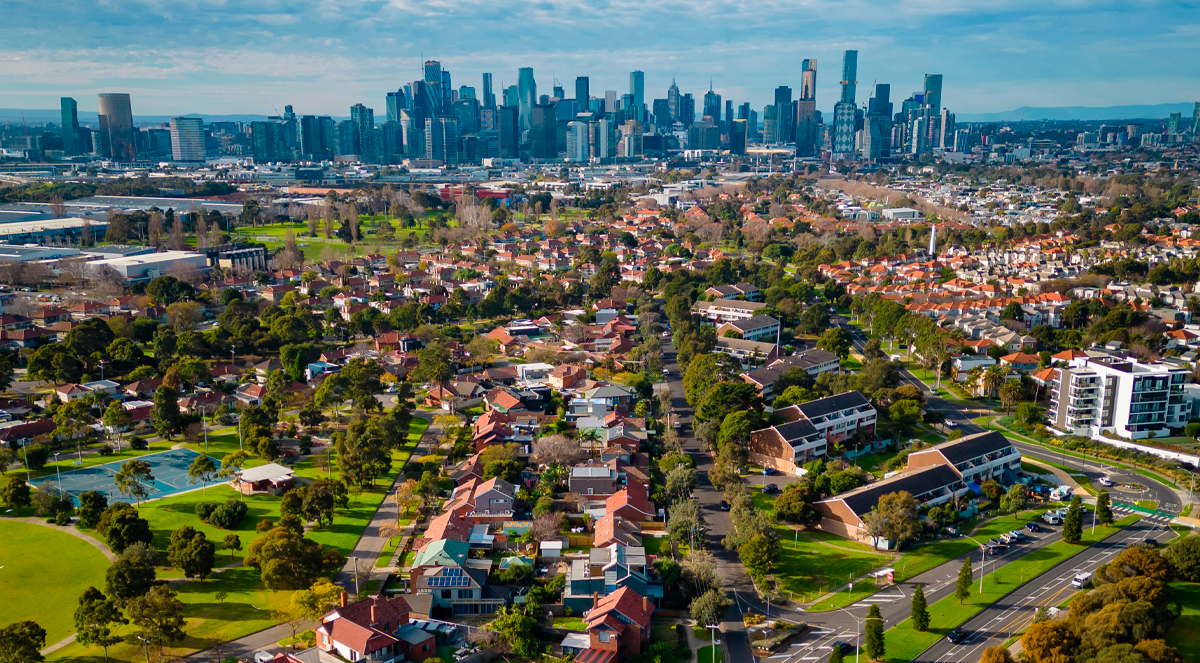
Back in 1970, a Sydneysider could purchase a house for the median price of $18,700. Fast forward to today, and as of August 2023, the Sydney median house price now sits at $1.33 million.
It’s a stark reality for young people trying to crack into the market, and might even act as a deterrent. But if history continues to repeat itself, the cost of a home now might seem dismal to future homebuyers looking back in time, just as we are now.
To best understand where property prices are heading, it might be helpful to take a look at previous growth cycles, and understand what drove them, and what slowed them down.
Here are some of the significant events in Australian history that have shaped property prices into what they are today.
1949 - In 1949 price caps that were implemented on house prices and rents post World War II were finally lifted after seven years, sending house prices skyward.
According to MorningStar, house prices in Sydney increased by 77 percent in the 12 months preceding the price cap lift. A year later, in 1950, house prices fell 25 percent. This was due to the rapid growth recently experienced, but it wasn’t enough to dampen the gains.
Late 1960s - 1975 - Australian house prices benefitted from the mining boom that occurred in 1960, and then the finance boom that happened in the early 70s.
During this time, house prices rose substantially. In the six years from 1970 to 1976, the median Sydney house price almost doubled, from $18,700 to $36,800, according to a report by Peter Abelson and Demi Chung, published by McCrindle.
This rapid growth in house prices happened against a backdrop of rising interest rates, which increased from 5.88 percent in 1970 up to 10.38 percent in 1975, according to a report by Datamentary, published by Savings.
1975-1980 - In the later half of the 70s house prices in Sydney jumped from $34,300 up to $68,850 in just five years, according to Abelson and Chung. That means they doubled, despite relatively high interest rates.
From 1976 to 1980, interest rates experienced a mild reprieve from their recent spike. They decreased from 10.38 percent to 9.13 percent, according to Datamentary.
1980-1990 - In 1980 the average residential home loan rate was 9.13 percent, according to Datamentary. By 1990, it had soared to 17.5 percent - the highest rate on record.
Despite record high interest rates, the annual median Sydney house price almost tripled during this time, from $68,850 in 1980 to $194,000 in 1990 (Abelson & Chung).
According to MorningStar, the 1980s was characterised by an increase in access to credit, resulting in a lending and building boom. This would fall off in the 1990s, culminating in a debt crisis, and resulting in the demise of multiple banks.
1990-2000 - The 1990s saw the country experience the ‘recession we had to have’, as described by former Prime Minister, Paul Keating.
According to MorningStar, GDP fell by 1.7 percent and unemployment jumped to 10.8 percent. House prices remained resilient however, dropping only 8 percent nationally.
The annual median Sydney house price fell from $194,000 to $182,000 in 1991. But by 1995 Sydney house prices had rebounded again, reaching a new high of $196,000.
The remainder of the century continued to experience strong price growth, with the Sydney median house price reaching $287,000 by the year 2000 - clocking almost $100,000 of growth over the decade (Abelson & Chung).
2000-2010 - Australian property came out of the 1990s recession stronger than ever, with capital city house prices increasing 61.9 percent over the five years spanning 1998 until 2003, according to SmartCompany.
The median Sydney house price skyrocketed from $248,750 in 1998 to $454,250 in 2003, providing handsome equity for property owners, and taking house prices to heights never before seen in Australia.
Interest rates had recently fallen from a peak of 17 percent in 1990, down to 6.4 percent in 1999. They continued to linger around the 6-7 percent mark until 2006 when they gradually began to rise to 9.6 percent in 2008, before taking a sharp dive in 2009 to 5.6 percent.
From 2003 until 2008, house prices in specific regions benefited from the Australian mining boom according to SmartCompany, with house prices in regional Western Australia and Perth doubling, as workers flocked to the western state.
This resulted in the regions performing better than capital cities, in a rarely seen phenomenon.
But house price growth in regional areas, where seasonal demand was volatile, were eventually interrupted when mines closed and work dried up. Capital cities continued to climb at a more steady and stable rate.
The decade ended with the Global Financial Crisis, and while it was widely expected that property prices would fall, they remained resilient yet again.
They dropped only briefly in 2009, which was linked to a tightening in lending policy and credit availability, rather than the GFC itself, according to Finder. But by 2010 national dwelling price growth had returned strongly, with house prices reaching new records by 2011.
2010 - Now - House prices continued to climb at a steady rate, while the interest rate slowly dropped from 7.04 percent in 2011, down to an average rate of 3.65 percent in 2020.
From March 2012 to March 2022, the average price of a residential dwelling in NSW increased by 123.4 percent, according to MoneyQuest. That’s equivalent to an increase of $675,200 in just ten years.
Perhaps the most notable growth period since 2010 has been the recent pandemic boom, when prices experienced fast growth while buyers benefitted from record low interest rates and large savings spurred on by the pandemic.
From September 2020 until April 2022, national dwelling prices soared 28.6 percent, according to CoreLogic.
When interest rates began to rise again, it was widely believed that house prices would take a steep and prolonged dive, but that hasn’t quite materialised.
Instead, house prices did take a dive, falling 9.1 percent nationally, but the decline was short and sharp, with price rises now making ground after six consecutive months of growth since finding a floor in February this year.
Sydney dwelling prices are now sitting 1.2 percent up over the past 12 months, making back all but some of their recent losses.
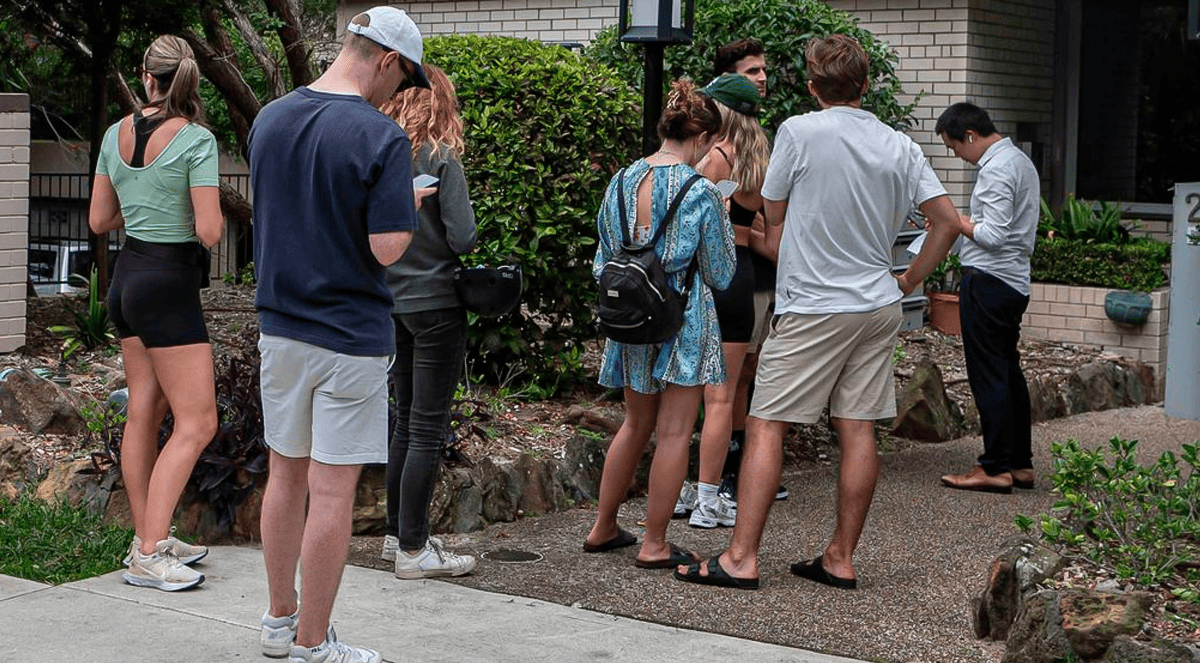
While significant events in monetary policy, and the broader economic landscape can evidently impact house prices, what has been made even more obvious through recent market developments is the gravitas that supply and demand can have on house prices.
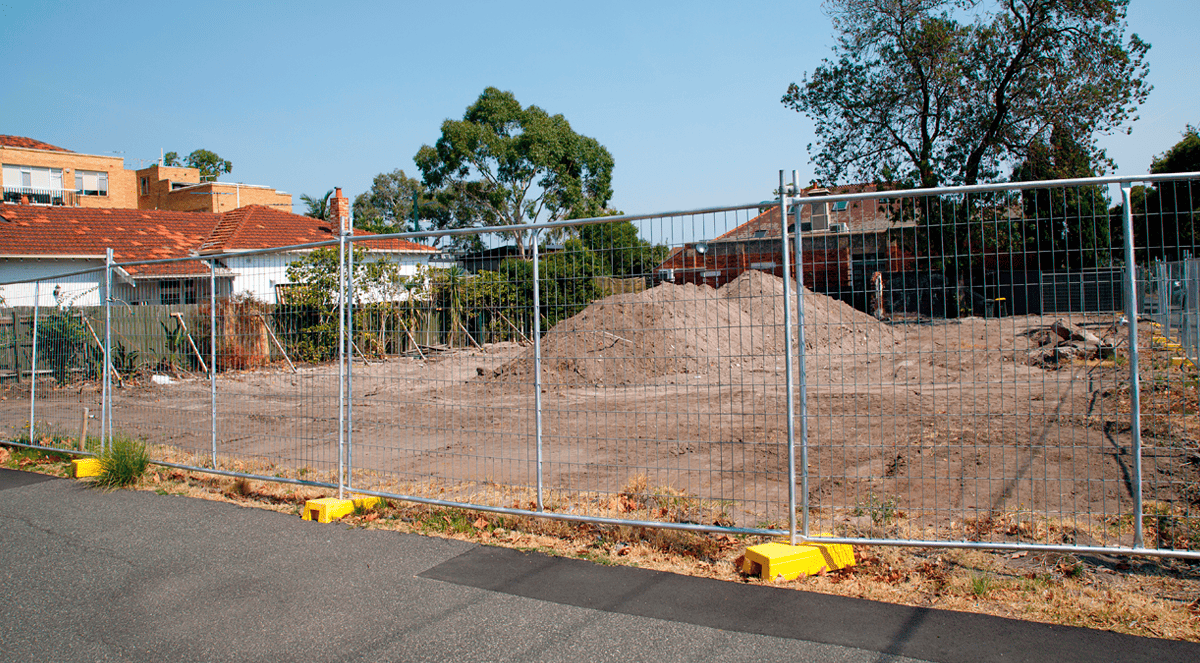
Rising interest rates may have some initial and slight effects on housing prices, there are bigger factors at play, like credit availability, population growth, and construction capacity and performance.
Then there are factors like available land, planning and approval processes, and development taxes that have undoubtedly shaped the Australian property market into its current form today.
It’s also worth noting that government contribution to construction in the residential sector has fallen right off, from 24 percent of all new housing stock being government funded in 1947-1961, to the government building less than 4000 dwellings annually from 1999 until 2009.
Additionally, supply has failed to keep pace with demand in general, with new housing stock added outpacing population growth until the 1990’s. Since then, it has dropped off substantially.
Now, Australian property prices are edging upwards once again, on the back of increased migration, tight supply, and construction constraints. We’re also at the peak of a rate hiking cycle, and as rates come off there’s a good chance that price increases could accelerate, if history is anything to go off.


.png?width=292&height=292&name=Copy%20Link%20(1).png)

 SIGN UP FOR FREE NEWSLETTER


%20Scott%20Kuru%20DPU%20248.jpg?width=1920&height=1080&name=Major%20Banks%20CAUGHT%20Preparing%20For%20Australia%E2%80%99s%20Biggest%20Housing%20Crash%20(Defaults%20%26%20Bankruptcies%20Coming)%20Scott%20Kuru%20DPU%20248.jpg)
%20Scott%20Kuru%20DPU%20247.jpg?width=1920&height=1080&name=This%20Is%20How%20Australia%20Gets%20Pushed%20Into%20the%20Next%20Big%20Reset%20(Trust%20Collapse%20Has%20Officially%20Begun)%20Scott%20Kuru%20DPU%20247.jpg)


%20Scott%20Kuru%20DPU%20239.jpg?width=1920&height=1080&name=URGENT%20Life%20In%20Australia%20Has%20Become%20Impossible%20For%20Millions%20Of%20Aussies%20(It%E2%80%99s%20About%20To%20Get%20Worse)%20Scott%20Kuru%20DPU%20239.jpg)


%20Scott%20Kuru%20DPU%20227.jpg?width=1920&height=1080&name=URGENT%20ALERT%20Australia%E2%80%99s%20Property%20Market%20Is%20Sliding%20Into%20Something%20Much%20Bigger%20(Prepare%20Now)%20Scott%20Kuru%20DPU%20227.jpg)


%20Scott%20Kuru%20DPU%20221.jpg?width=1920&height=1080&name=The%20AI%20Situation%20in%20Australia%20Just%20Hit%20a%20Point%20of%20No%20Return...%20(Major%20Bank%20Proves%20It)%20Scott%20Kuru%20DPU%20221.jpg)


%20Scott%20Kuru%20DPU%20218.jpg?width=1920&height=1080&name=URGENT%20Australia%E2%80%99s%20Diesel%20Supply%20Is%20Far%20Worse%20Than%20People%20Realise%20(Major%20Bank%20Warns)%20Scott%20Kuru%20DPU%20218.jpg)

%20Scott%20Kuru%20DPU%20216.jpg?width=1920&height=1080&name=This%20Is%20How%20Recessions%20Start%20Aussies%20Are%20Shutting%20Their%20Wallets%20(Prepare%20Now)%20Scott%20Kuru%20DPU%20216.jpg)


%20Scott%20Kuru%20DPU%20213.jpg?width=1920&height=1080&name=BREAKING%20Australia%E2%80%99s%20Govt%20Just%20Got%20Caught%20(The%2047%25%20%E2%80%9CPartner%E2%80%9D%20Tax%20Grab)%20Scott%20Kuru%20DPU%20213.jpg)


%20Scott%20Kuru%20DPU%20203.jpg.jpg?width=1920&height=1080&name=Australia%E2%80%99s%20Housing%20Crisis%20Just%20Flipped%20Again%20(BIGGEST%20MARKET%20CRASH%20COMING)%20Scott%20Kuru%20DPU%20203.jpg.jpg)


%20Scott%20Kuru%20DPU%20200.jpg?width=1920&height=1080&name=The%20Govt%E2%80%99s%20Biggest%20Money%20Grab%20The%20Average%20Aussie%20Is%20Getting%20Crushed%20(And%20It%E2%80%99s%20Getting%20Worse)%20Scott%20Kuru%20DPU%20200.jpg)

%20Scott%20Kuru%20DPU%20198.jpg?width=1920&height=1080&name=Farmers%20Panic%20as%20Fuel%20Crisis%20Takes%20Over%20Australia%E2%80%99s%20Fertiliser%20Supply%20(Food%20Shock%20Has%20Begun)%20Scott%20Kuru%20DPU%20198.jpg)
%20Scott%20Kuru%20DPU%20197.jpg?width=1920&height=1080&name=URGENT%20Australia%E2%80%99s%20Property%20Market%20Is%20One%20Rate%20Hike%20Away%20From%20Snapping%20(This%20Is%20How%20It%20Starts)%20Scott%20Kuru%20DPU%20197.jpg)

%20Scott%20Kuru%20DPU%20195.jpg?width=1920&height=1080&name=The%20Biggest%20$83Bn%20Housing%20Scam%20Just%20Got%20Exposed%20(They%E2%80%99re%20Addicted%20to%20Taxing%20the%20Everyday%20Aussie)%20Scott%20Kuru%20DPU%20195.jpg)


%20Scott%20Kuru%20DPU%20192.jpg?width=1920&height=1080&name=The%20Middle%20Class%20Is%20Getting%20Wiped%20Out%20of%20Housing%20(Even%20When%20They%20Do%20Everything%20Right)%20Scott%20Kuru%20DPU%20192.jpg)


%20Scott%20Kuru%20DPU%20184.jpg?width=1920&height=1080&name=The%20Biggest%20Construction%20Collapse%20In%20Australian%20History%20Just%20Got%20Worse%20(300%2c000%20Homes%20Scrapped)%20Scott%20Kuru%20DPU%20184.jpg)
%20Scott%20Kuru%20DPU%20183.jpg?width=1920&height=1080&name=Australia%20To%20Declare%20Oil%20Emergency%20As%20US%20Cuts%20Off%20Oil%20Supply%20To%20Singapore%20(Oil%20Deal%20Under%20Threat)%20Scott%20Kuru%20DPU%20183.jpg)


.jpg?width=1920&height=1080&name=BREAKING%20The%20Govt%20Just%20Got%20Caught%20Red-Handed%20Manipulating%20Inflation%20-%20%20What%20They%E2%80%99re%20Not%20Telling%20You%20Scott%20Kuru%20DPU%20174%20(1).jpg)


%20Scott%20Kuru%20DPU%20%20171.jpg?width=1920&height=1080&name=BREAKING%20Something%20Big%20Just%20Flipped%20Australia%E2%80%99s%20Housing%20Market%20Outlook%20(No%20One%20Saw%20It%20Coming)%20Scott%20Kuru%20DPU%20%20171.jpg)
%20Scott%20Kuru%20DPU%20170.jpg?width=1920&height=1080&name=BREAKING%20Did%20Australia%20Just%20Sign%20the%20Worst%20Trade%20Deal%20with%20Europe%20(Ripped%20Off%20by%20$10B)%20Scott%20Kuru%20DPU%20170.jpg)
